
 Yahoo Movies
 Worst Periods for the American Economy Since 1900

The American economy has always been cyclical, going from boom to bust and back again. However, 2020 saw an entire economic cycle in a matter of months. The economy was in a solid expansion at the beginning of the year; however, the arrival of the coronavirus pandemic decimated the upswing, driving millions of Americans to the unemployment line. Only time will tell if this decade turns out to be historically good or bad, economically speaking.
See: Majority of US Companies May Require COVID-19 Vaccine, Survey Finds
Follow Along: 31 Days of Living Richer
By way of comparison, here's a look at the best and worst decades of the modern economy, from 1900 through the present day. Periods were analyzed based on a number of economic and statistical factors. See how stock market performance and housing prices, wage growth, unemployment figures and gross national product numbers changed with the times.
Last updated: Oct. 20, 2021

1900-1920
Median Home Price: N/A
Annual Inflation Rate: 0% in 1900 to 3.7% in 1910 to 15.6% in 1920
The modern economy in America really began around the turn of the century, when the country shifted toward industrialism and away from agrarianism. Although the roots of industrialism can be traced to the end of the 19th century, corporations began to boom after the turn of the century, highlighted by Andrew Carnegie's empire consolidating into U.S. Steel in 1901. The Dow Jones industrial average would also clear 100 points for the first time ever during Theodore Roosevelt's presidency.
See: How the Stock Market Performed Under Each President

Analysis
Worst time period: 1907-08
Mass production of the modern automobile at Henry Ford's factory began in 1913, helping to usher in a new wave of mass consumerism. Moreover, a flood of immigrants -- over 13 million between 1900 and 1914 -- offered cheap labor for economic expansion.
Despite this economic growth, the U.S. found itself in a recession at the outbreak of World War I. However, spending during the war years helped create a boom that lasted until the recession of 1920. Working conditions also began a slow process of improvement, as federal agencies and mobilized citizens focused on the dangers facing manufacturing employees. Overall, the nascent American industrial economy improved dramatically from 1900 to 1920.
2021 Small Business Spotlight: Check Out Our Small Business Stories, Plus the Nominated Businesses Near You
1920-1930
Median Home Price: N/A
Annual Inflation Rate: 15.6% in 1920 to -2.7% in 1930
The "Roaring 20s" are oft-romanticized in film and print, but the net economic effect of the period was actually a mixed bag. In fact, the 1920s began and ended with recessions.
Discover: Here's What the Minimum Wage Was the Year You Were Born
Analysis
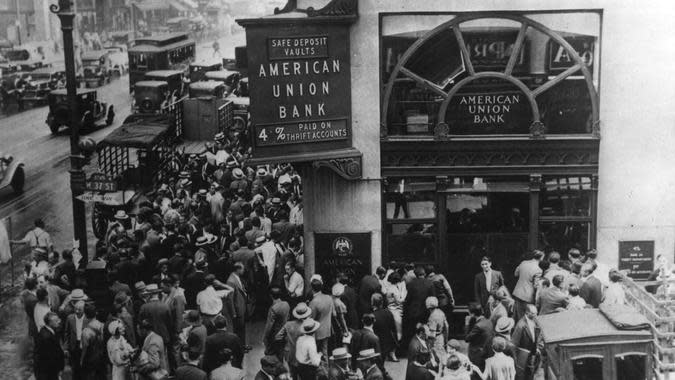
Worst time period: 1929-30
Monetary policy helped trip up the economy at the beginning of the 1920s, leading to a recession that wasn't fully resolved until 1923. However, that setback was nothing compared to the effects of the stock market crash in 1929. On Oct. 24, 1929 -- now known as Black Tuesday -- the Dow Jones industrial average fell 23% in a single day. Along with setting off the Great Depression, the crash led to a decline in housing prices that would last throughout the 1930s.
Still, for the decade as a whole, the economy performed well. The Standard & Poor's 500 index reached 248.48 by the end of 1929 and gross national product (GNP) grew 4.2% every year from 1920 to 1929.
Discover: The Economy and Your Money: All You Need To Know

1930-1940
Median Home Price: $2,938 in 1940
Annual Inflation Rate: -2.7% in 1930 to 0.7% in 1940
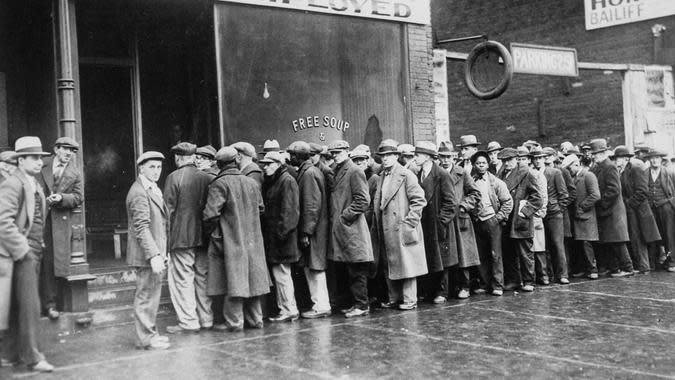
The 1930s represent a rough patch for the American economy. Although the stock market crashed in 1929, it wasn't until the 1930s that the full economic effects of the worst depression in American history were felt. In fact, the U.S. economy didn't rebound until the outbreak of World War II.
Analysis
Worst time period: 1930-33
During this period, the stock market continued its downward slump, with the S&P 500 dropping a total of 86.1% from September 1929 to June 1932. The Dow also hit its lowest point during this period, bottoming out in the summer of 1932.
From 1929 to 1932, national income plummeted by more than 50%, with construction incomes falling 80%. In Manhattan, the average home value fell 51% between 1929 and 1933. The third-worst recession of the 20th century hit in May 1937, driving unemployment back up to 20% and knocking 10% off the GDP.
It wasn't until the U.S. entered World War II in 1941 that the country's GDP climbed back to 1929 levels.

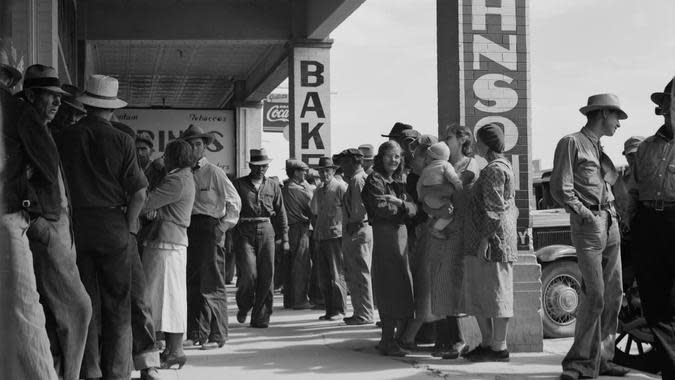
1940-1950
Median Home Price: $2,938 in 1940 to $7,354 in 1950
Average Inflation Rate: 0.7% in 1940 to 1.1% in 1950
Once America entered World War II, the entire economy was retooled for wartime production, and both GNP and employment rose dramatically.

Analysis
Worst time period: 1946-49
After the boom of the war years, an "inventory recession" hit, during which there was an excess of available goods, and Americans became savers rather than spenders. This period lasted from May 1946 to June 1949 and triggered a 29.6% slide in the S&P 500.
Median home prices also rose in the 1940s, and the unemployment rate dropped from about 15% to about 5.5%.
Read More: Americans' Savings Drop to Lowest Point in Years

1950-1960
Median Home Price: $7,354 in 1950 to $11,900 in 1960
Average Inflation Rate: 1.1% in 1950 to 1.5% in 1960
The postwar expansion carried over into the 1950s, with nearly full employment lasting until the end of the Korean War in 1953. Overall, the unemployment rate remained remarkably stable, starting the decade at 5.3% and ending at 5.5%.

Analysis
Worst time period: 1957-58
The economic success of the decade was also reflected in the performance of the Dow Jones, which rose from 200.52 at the end of 1949 to 679.36 at the end of 1959. Remarkably, there wasn't a single bear market throughout the decade. Moreover, the median income jumped from $3,319 to $5,620.
The 1950s are often looked back on nostalgically as "happy days" -- immortalized forever by a popular sitcom of the same name. Along with an increase in European demand for American goods, the economy saw housing prices become more affordable as wages rose. However, on a social level, black Americans still endured lower wages, segregation and Jim Crow laws that kept them from participating fully in American growth.

1960-1970
Median Home Price: $11,900 in 1960 to $17,000 in 1970
Average Inflation Rate: 1.5% in 1960 to 5.8% in 1970
The 1960s were a socially tumultuous period in which the economy experienced similar ups and downs. Two recessions hit America in the 1960s, the first lasting from December 1961 to June 1962, and the second from November 1968 to May 1970.

Analysis
Worst time period: 1968-70
The first recession sent the S&P 500 down 28% and was primarily triggered by Cold War fears, after the Bay of Pigs operation in April 1961 and the Cuban Missile Crisis in October 1962. A tax cut envisioned by President John F. Kennedy helped pull America out of this short recession, as did the start of the Vietnam War, which triggered economic expansion.
The turmoil of 1968 -- due in part to the eruption of civil rights violence, rising opposition to the war in Vietnam and the assassinations of Robert Kennedy and Martin Luther King, Jr. -- was in the background of an economy that flirted with 6% inflation. The ensuing recession trimmed 36.1% off the S&P 500.
Although the economy finished the decade in recession, real wages did increase significantly during this period. Across all domestic industries, average annual wages and salaries rose from $4,817 in 1960 to $7,711 in 1970.
Find Out: What $1 Could Buy the Year You Were Born

1970-1980
Median Home Price: $17,000 in 1970 to $47,200 in 1980
Average Inflation Rate: 5.8% in 1970 to 13.5% in 1980
The 1970s were the "stagflation" decade, characterized by a muted economy coupled with the effects of rising inflation. The economic disaster of the decade was highlighted by President Gerald Ford, who began the "Economic Report of the President" for 1975 with the words, "The economy is in a severe recession. Unemployment is too high and will rise higher."

Analysis
Worst time period: 1973-75
From October 1973 to January 1974, the economy suffered the effects of the Yom Kippur War and the Arab oil embargo, which drove oil prices from $2.90 per barrel to $11.65. A second oil shock hit the U.S. economy in 1978, concurrent with the Iranian revolution, which doubled the price of oil between April 1979 and April 1980. In response to a simultaneous rise in inflation, the Federal Reserve began an aggressive campaign to hike interest rates, which rose from 6.9% in April 1978 to 19% in 1981.
Although the Fed hikes helped corral inflation, they also set the stage for a rough start to the 1980s.

1980-1990
Median Home Price: $47,200 in 1980 to $79,100 in 1990
Average Inflation Rate: 13.5% in 1980 to 5.4% in 1990
By 1980, the Federal Reserve had jacked up interest rates to nearly 20%. The result was a recessed economy and a presidential win for Ronald Reagan.
Analysis
Worst time period: 1980-82
The 21-month recession, which didn't bottom out until August 1982, saw the S&P 500 drop 27.8%, from 140.52 to 101.44.
Between 1982 and 1987, the economy recovered nicely; however, a combination of inflated asset values and "program trading" by computers triggered the "Black Monday" sell-off of Oct. 19, 1987. By the end of the day, the Dow Jones had fallen 22.6%: the worst single-day drop since 1914. After a net loss in the S&P 500 of 33.5%, the market bottomed fairly rapidly by December 1987.
Additionally, the 1980s saw a significant drop in interest rates, with the U.S. prime rate falling from 15.26% in 1980 to 10.01% in 1990. As rates plummeted, assets in savings and loans institutions skyrocketed, and risky thrifts began operating aggressively and without sound financial strategies. The government had to step in, spending $124 billion to close out 747 savings and loans institutions.
All this economic turmoil contributed to the recession of the early 1990s. For some perspective, here is what the prime rate is currently

1990-2000
Median Home Price: $79,100 in 1990 to $119,600 in 2000
Average Inflation Rate: 5.4% in 1990 to 3.4% in 2000
The 1990s are widely regarded as a period of economic prosperity. From the end of 1990 to the end of 2000, the S&P 500 exactly quadrupled, rising from 330 to 1,320.

Analysis
Worst time period: 1990-91
In addition to the S&P 500's boom, the inflation rate fell from 5.4% to 3.4%, the U.S. 30-year mortgage rate fell from 10.13% to 8.05% and the number of bank failures dropped from 381 to just 7.
Despite these gains, the 1990s were a bit of a bumpy ride. The hangover of the 1987 stock market crash -- and the subsequent failures of numerous savings and loan associations -- hurt many American households and created a drain on federal resources. Coupled with rising interest rates and the spike in oil triggered by Iraq's invasion of Kuwait in 1990, a recession was almost inevitable in the early part of the decade.
After President Bill Clinton took office in 1993, however, the U.S. economy embarked on a long and strong expansion, making the 1990s a great decade for America's money, overall.

2000-2010
Median Home Price: $119,600 in 2000 to $179,900 in 2010
Average Inflation Rate: 3.4% in 2000 to 1.6% in 2010
The turn of the century saw the extension of the boom that began in 1990. But it would all come apart in 2001 -- and then again in 2008. From the end of 2000 to the end of 2010, the S&P 500 actually lost money, falling from 1,320 to 1,258. Along the way, the index peaked at 1,527.46 in 2001 and then crashed to 776.76 over a period of 30 months.

Analysis
Worst time period: 2007-09
The early 2000s were a particularly tough time for the housing market. After the gyrations of 2001, the subprime mortgage crisis -- which brought with it the destruction of the housing market -- struck in full force in 2008. During this time, housing prices tumbled a shocking 12.4% from 2007 to 2008, from a median of $205,700 to $180,100. In other markets, such as Southern California, home prices fell as much as 35%, further cementing the decade's poor economic legacy.
Even as Americans struggled to pay their mortgages, unemployment rates rose across the country. In 2006, unemployment was at 4.5%, but it soared to 9% by 2009. The S&P 500 was similarly volatile during this time. After peaking at 1565.15 on Oct. 9, 2007, the market bottomed out at 682.55 on March 5, 2009.

2010-2020
Median Home Price: $179,900 in 2010 to $259,906 in October 2020, according to Zillow
Average Inflation Rate: 1.6% in 2010 to 1.8% as of March 2020
The 2010s marked a recovery time for the U.S. economy. Inflation actually doubled from 2010 to 2011, and the S&P 500 was exactly flat, at 1,258 at the end of both 2010 and 2011. However, the economy slowly improved, thanks in no small part to the exceedingly accommodating policies of the Federal Reserve. From 2010 to October of 2020, the federal funds rate fell from 0.18% to just 0.09%, providing both economic support and a prop for the stock market.

Analysis
Worst time period: 2020
The low federal funds rate allowed for inexpensive borrowing for both businesses and consumers, a fact that contributed to economic growth. All seemed well until early 2020, when the coronavirus pandemic struck and decimated both the American economy and the stock market. Unemployment skyrocketed to an all-time high of 14.7% in April 2020, with more than 20 million jobs lost in a single month, also an all-time high. The Dow Jones Industrial Average fell a whopping 26% in March 2020, as news of the outbreak spread and fear set in.
Although the net result of the coronavirus pandemic is still unfolding, the stock market -- and the economy -- have seemed to recover quite admirably thus far.
Following the traditional pattern of the business cycle, the American economy has consistently encountered both boom and bust periods. Although wars have often been the answer to ending American recessions, the influence of the global economy and sound domestic economic policies have also helped to right the ship.
More From GOBankingRates
Fourth Stimulus Checks Are Coming From These States — Is Yours on the List?
Here’s How Much You Need To Earn To Be ‘Rich’ in 23 Major Countries Around the World
Note: Median home prices were sourced from the U.S. Census Bureau and inflation rates were sourced from the Bureau of Labor Statistics.
This article originally appeared on GOBankingRates.com: Worst Periods for the American Economy Since 1900

