
 Yahoo Movies
 Wells Fargo (NYSE:WFC) shareholders have endured a 14% loss from investing in the stock five years ago
In order to justify the effort of selecting individual stocks, it's worth striving to beat the returns from a market index fund. But every investor is virtually certain to have both over-performing and under-performing stocks. At this point some shareholders may be questioning their investment in Wells Fargo & Company (NYSE:WFC), since the last five years saw the share price fall 26%. We also note that the stock has performed poorly over the last year, with the share price down 22%. Furthermore, it's down 11% in about a quarter. That's not much fun for holders.
So let's have a look and see if the longer term performance of the company has been in line with the underlying business' progress.
See our latest analysis for Wells Fargo
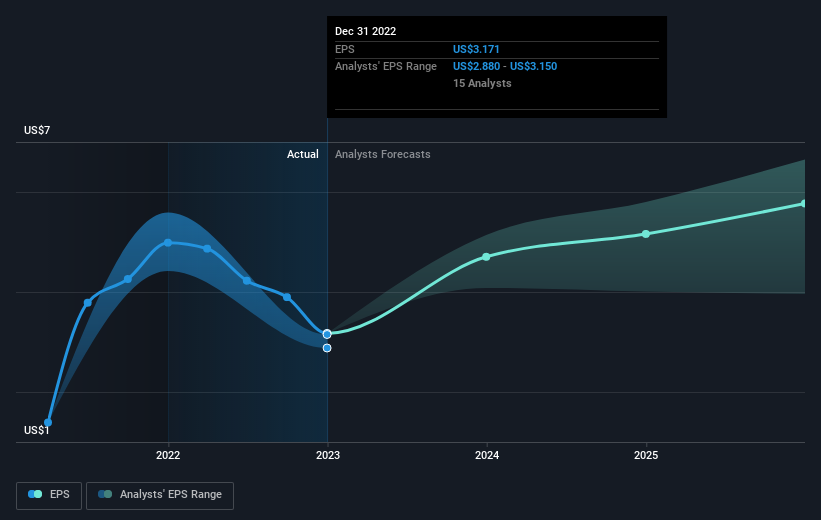
To quote Buffett, 'Ships will sail around the world but the Flat Earth Society will flourish. There will continue to be wide discrepancies between price and value in the marketplace...' One way to examine how market sentiment has changed over time is to look at the interaction between a company's share price and its earnings per share (EPS).
Looking back five years, both Wells Fargo's share price and EPS declined; the latter at a rate of 5.1% per year. This change in EPS is reasonably close to the 6% average annual decrease in the share price. This implies that the market has had a fairly steady view of the stock. Rather, the share price has approximately tracked EPS growth.
You can see below how EPS has changed over time (discover the exact values by clicking on the image).
It might be well worthwhile taking a look at our free report on Wells Fargo's earnings, revenue and cash flow.
What About Dividends?
When looking at investment returns, it is important to consider the difference between total shareholder return (TSR) and share price return. Whereas the share price return only reflects the change in the share price, the TSR includes the value of dividends (assuming they were reinvested) and the benefit of any discounted capital raising or spin-off. Arguably, the TSR gives a more comprehensive picture of the return generated by a stock. We note that for Wells Fargo the TSR over the last 5 years was -14%, which is better than the share price return mentioned above. And there's no prize for guessing that the dividend payments largely explain the divergence!
A Different Perspective
While the broader market lost about 9.2% in the twelve months, Wells Fargo shareholders did even worse, losing 20% (even including dividends). However, it could simply be that the share price has been impacted by broader market jitters. It might be worth keeping an eye on the fundamentals, in case there's a good opportunity. Regrettably, last year's performance caps off a bad run, with the shareholders facing a total loss of 3% per year over five years. Generally speaking long term share price weakness can be a bad sign, though contrarian investors might want to research the stock in hope of a turnaround. I find it very interesting to look at share price over the long term as a proxy for business performance. But to truly gain insight, we need to consider other information, too. For example, we've discovered 3 warning signs for Wells Fargo that you should be aware of before investing here.
Of course Wells Fargo may not be the best stock to buy. So you may wish to see this free collection of growth stocks.
Please note, the market returns quoted in this article reflect the market weighted average returns of stocks that currently trade on American exchanges.
Have feedback on this article? Concerned about the content? Get in touch with us directly. Alternatively, email editorial-team (at) simplywallst.com.
This article by Simply Wall St is general in nature. We provide commentary based on historical data and analyst forecasts only using an unbiased methodology and our articles are not intended to be financial advice. It does not constitute a recommendation to buy or sell any stock, and does not take account of your objectives, or your financial situation. We aim to bring you long-term focused analysis driven by fundamental data. Note that our analysis may not factor in the latest price-sensitive company announcements or qualitative material. Simply Wall St has no position in any stocks mentioned.
Join A Paid User Research Session
You’ll receive a US$30 Amazon Gift card for 1 hour of your time while helping us build better investing tools for the individual investors like yourself. Sign up here

