
 Yahoo Movies
 Is Weakness In M Winkworth PLC (LON:WINK) Stock A Sign That The Market Could be Wrong Given Its Strong Financial Prospects?
M Winkworth (LON:WINK) has had a rough month with its share price down 18%. However, stock prices are usually driven by a company’s financial performance over the long term, which in this case looks quite promising. Particularly, we will be paying attention to M Winkworth's ROE today.
ROE or return on equity is a useful tool to assess how effectively a company can generate returns on the investment it received from its shareholders. In other words, it is a profitability ratio which measures the rate of return on the capital provided by the company's shareholders.
See our latest analysis for M Winkworth
How Is ROE Calculated?
Return on equity can be calculated by using the formula:
Return on Equity = Net Profit (from continuing operations) ÷ Shareholders' Equity
So, based on the above formula, the ROE for M Winkworth is:
41% = UK£2.6m ÷ UK£6.3m (Based on the trailing twelve months to December 2021).
The 'return' is the profit over the last twelve months. That means that for every £1 worth of shareholders' equity, the company generated £0.41 in profit.
Why Is ROE Important For Earnings Growth?
Thus far, we have learned that ROE measures how efficiently a company is generating its profits. We now need to evaluate how much profit the company reinvests or "retains" for future growth which then gives us an idea about the growth potential of the company. Assuming everything else remains unchanged, the higher the ROE and profit retention, the higher the growth rate of a company compared to companies that don't necessarily bear these characteristics.
M Winkworth's Earnings Growth And 41% ROE
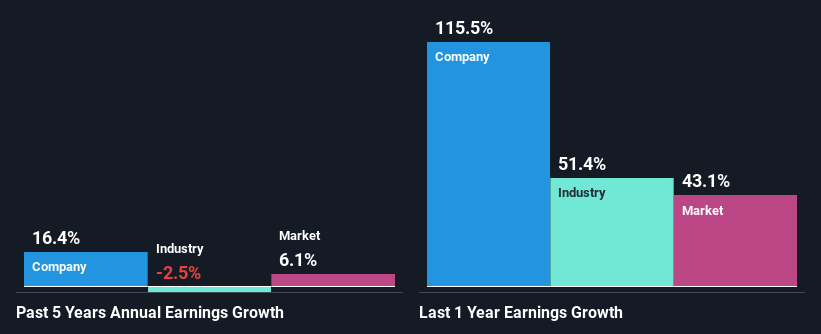
First thing first, we like that M Winkworth has an impressive ROE. Secondly, even when compared to the industry average of 12% the company's ROE is quite impressive. This probably laid the groundwork for M Winkworth's moderate 16% net income growth seen over the past five years.
When you consider the fact that the industry earnings have shrunk at a rate of 2.5% in the same period, the company's net income growth is pretty remarkable.
Earnings growth is a huge factor in stock valuation. What investors need to determine next is if the expected earnings growth, or the lack of it, is already built into the share price. By doing so, they will have an idea if the stock is headed into clear blue waters or if swampy waters await. One good indicator of expected earnings growth is the P/E ratio which determines the price the market is willing to pay for a stock based on its earnings prospects. So, you may want to check if M Winkworth is trading on a high P/E or a low P/E, relative to its industry.
Is M Winkworth Using Its Retained Earnings Effectively?
M Winkworth has a significant three-year median payout ratio of 76%, meaning that it is left with only 24% to reinvest into its business. This implies that the company has been able to achieve decent earnings growth despite returning most of its profits to shareholders.
Moreover, M Winkworth is determined to keep sharing its profits with shareholders which we infer from its long history of paying a dividend for at least ten years. Our latest analyst data shows that the future payout ratio of the company over the next three years is expected to be approximately 84%.
Conclusion
Overall, we are quite pleased with M Winkworth's performance. Especially the high ROE, Which has contributed to the impressive growth seen in earnings. Despite the company reinvesting only a small portion of its profits, it still has managed to grow its earnings so that is appreciable. So far, we've only made a quick discussion around the company's earnings growth. So it may be worth checking this free detailed graph of M Winkworth's past earnings, as well as revenue and cash flows to get a deeper insight into the company's performance.
Have feedback on this article? Concerned about the content? Get in touch with us directly. Alternatively, email editorial-team (at) simplywallst.com.
This article by Simply Wall St is general in nature. We provide commentary based on historical data and analyst forecasts only using an unbiased methodology and our articles are not intended to be financial advice. It does not constitute a recommendation to buy or sell any stock, and does not take account of your objectives, or your financial situation. We aim to bring you long-term focused analysis driven by fundamental data. Note that our analysis may not factor in the latest price-sensitive company announcements or qualitative material. Simply Wall St has no position in any stocks mentioned.

