
 Yahoo Movies
 Is W.W. Grainger, Inc.'s (NYSE:GWW) Stock's Recent Performance Being Led By Its Attractive Financial Prospects?
Most readers would already be aware that W.W. Grainger's (NYSE:GWW) stock increased significantly by 17% over the past month. Given the company's impressive performance, we decided to study its financial indicators more closely as a company's financial health over the long-term usually dictates market outcomes. Particularly, we will be paying attention to W.W. Grainger's ROE today.
Return on equity or ROE is a key measure used to assess how efficiently a company's management is utilizing the company's capital. In short, ROE shows the profit each dollar generates with respect to its shareholder investments.
See our latest analysis for W.W. Grainger
How Is ROE Calculated?
ROE can be calculated by using the formula:
Return on Equity = Net Profit (from continuing operations) ÷ Shareholders' Equity
So, based on the above formula, the ROE for W.W. Grainger is:
56% = US$1.4b ÷ US$2.5b (Based on the trailing twelve months to June 2022).
The 'return' refers to a company's earnings over the last year. Another way to think of that is that for every $1 worth of equity, the company was able to earn $0.56 in profit.
What Has ROE Got To Do With Earnings Growth?
So far, we've learned that ROE is a measure of a company's profitability. Based on how much of its profits the company chooses to reinvest or "retain", we are then able to evaluate a company's future ability to generate profits. Assuming everything else remains unchanged, the higher the ROE and profit retention, the higher the growth rate of a company compared to companies that don't necessarily bear these characteristics.
W.W. Grainger's Earnings Growth And 56% ROE
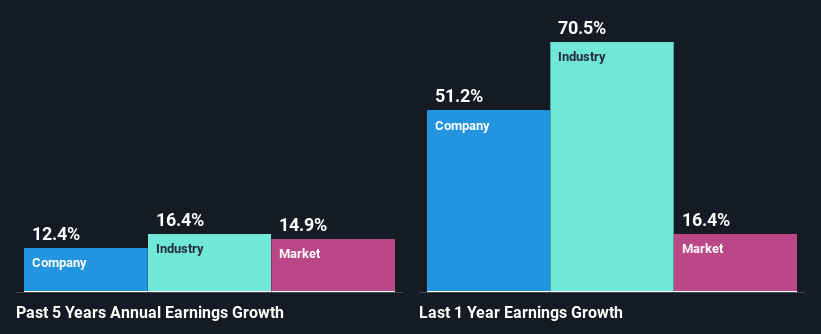
Firstly, we acknowledge that W.W. Grainger has a significantly high ROE. Additionally, the company's ROE is higher compared to the industry average of 23% which is quite remarkable. This probably laid the groundwork for W.W. Grainger's moderate 12% net income growth seen over the past five years.
Next, on comparing with the industry net income growth, we found that W.W. Grainger's reported growth was lower than the industry growth of 16% in the same period, which is not something we like to see.
Earnings growth is an important metric to consider when valuing a stock. It’s important for an investor to know whether the market has priced in the company's expected earnings growth (or decline). This then helps them determine if the stock is placed for a bright or bleak future. Is GWW fairly valued? This infographic on the company's intrinsic value has everything you need to know.
Is W.W. Grainger Using Its Retained Earnings Effectively?
W.W. Grainger has a healthy combination of a moderate three-year median payout ratio of 37% (or a retention ratio of 63%) and a respectable amount of growth in earnings as we saw above, meaning that the company has been making efficient use of its profits.
Moreover, W.W. Grainger is determined to keep sharing its profits with shareholders which we infer from its long history of paying a dividend for at least ten years. Existing analyst estimates suggest that the company's future payout ratio is expected to drop to 26% over the next three years. Regardless, the ROE is not expected to change much for the company despite the lower expected payout ratio.
Summary
On the whole, we feel that W.W. Grainger's performance has been quite good. Particularly, we like that the company is reinvesting heavily into its business, and at a high rate of return. As a result, the decent growth in its earnings is not surprising. With that said, the latest industry analyst forecasts reveal that the company's earnings growth is expected to slow down. To know more about the company's future earnings growth forecasts take a look at this free report on analyst forecasts for the company to find out more.
Have feedback on this article? Concerned about the content? Get in touch with us directly. Alternatively, email editorial-team (at) simplywallst.com.
This article by Simply Wall St is general in nature. We provide commentary based on historical data and analyst forecasts only using an unbiased methodology and our articles are not intended to be financial advice. It does not constitute a recommendation to buy or sell any stock, and does not take account of your objectives, or your financial situation. We aim to bring you long-term focused analysis driven by fundamental data. Note that our analysis may not factor in the latest price-sensitive company announcements or qualitative material. Simply Wall St has no position in any stocks mentioned.
Join A Paid User Research Session
You’ll receive a US$30 Amazon Gift card for 1 hour of your time while helping us build better investing tools for the individual investors like yourself. Sign up here

