How Do You Value Metaverse Projects? We Tried. Here’s What We Found
Don't miss CoinDesk's Consensus 2022, the must-attend crypto & blockchain festival experience of the year in Austin, TX this June 9-12.
The metaverse is probably overvalued.
We’ve seen funding in metaverse companies balloon to $12.1 billion in 2021 from $5.9 billion in 2020, according to Crunchbase. It’s hard to say if valuations are lofty even if most projects don’t have a working product. The companies and projects that garner funding are getting that funding based on potential.
Determining if that potential is overvalued is not easy, but we can try. We can take valuation techniques from traditional finance and adapt them for these metaverse companies in a way that could show us that maybe (just maybe), your favorite metaverse project is overvalued, fairly valued or even undervalued.
This piece is part of CoinDesk's Metaverse Week.
How are companies traditionally valued?
When a company is purchased, the most important deal point is valuation. And it’s not particularly close. How much does Alice need to pay Bob for Bob’s company? Doesn’t matter how favorable other terms (method of payment, closing conditions, breakup fees, etc.) are, you couldn’t purchase the family business from the Cargills for $100 million.
Generalizing even further, price is the most important deal point for any financial transaction. For initial public offerings, follow-on equity offerings, leveraged loans, corporate bonds, Small Business Administration (SBA) loans, Series A rounds and even your daily cup of coffee – price is paramount. What’s more, negotiating a favorable valuation is one of investment banks’ main services.
Read More: Metaverse Real Estate – Next Big Thing or Next Big Boondoggle?
In those negotiations, bankers from both sides present endless data points that support proposed valuations. Usually valuation is presented in terms of a multiple of sales, EBITDA (earnings before interest, taxes, depreciation and amortization), book value (the excess value of balance sheet assets less liabilities) or precedent transactions (what your local real estate agent would call “comps”). Sometimes bankers even use the academic’s favorite: the discounted cash flow, which is supposed to estimate the value of an investment based on expected future cash flows. (What’s usually conveniently left out is that a managing director massaged inputs to get the final number where they wanted it.)
That’s fine and dandy, but this is crypto, and this is Metaverse Week. How do these old chestnuts apply in the world of metaverse investment? Does any of it apply? How much should investors pay for these metaverse projects?
So how do you value a metaverse project or token?
Unlike traditional finance, there’s no tried-and-true method to apply here or a managing director who can tell me what to do. With the endless, paralyzing possibilities I settled on looking at one main metric.
Users.
Why users? For all its incoherent technobabble, the Web 3/metaverse crowd and thought leaders have made it abundantly clear that they are doing … whatever this is … for the users. The metaverse can mean many different things depending on whom you ask. It’s either gaming, augmented reality, non-fungible tokens (NFTs) or some combination. For simplicity, we are going to dive into these three crypto-focused metaverse projects: Decentraland, Axie Infinity and The Sandbox.
Fortunately for data junkies, we have a surplus of data that we can aggregate over time periods so granular it would make a career CFO’s head spin. If you wanted to look at user data and compare it to the market capitalization day by day, you could. So we will.
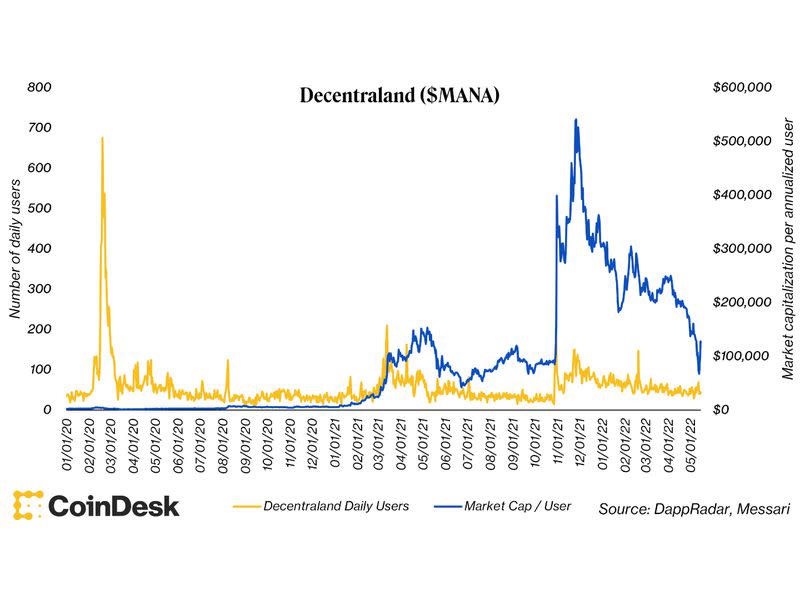
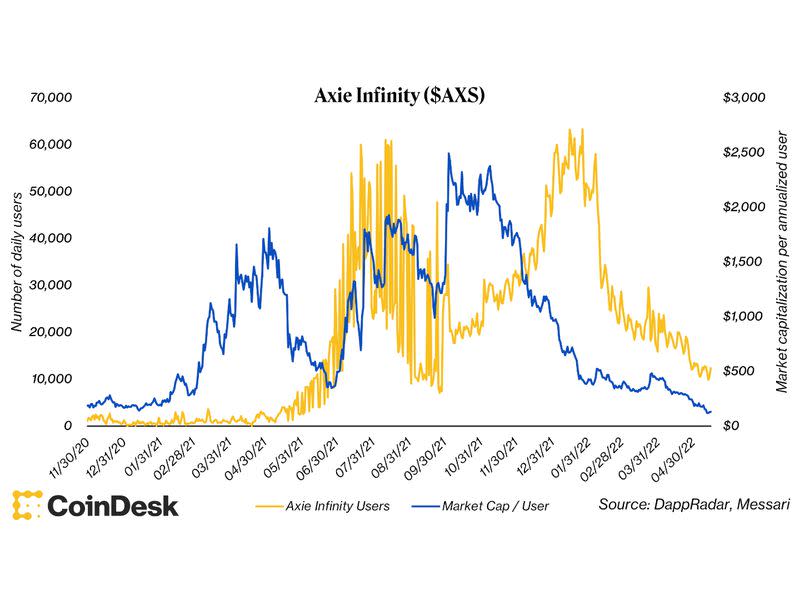
The following charts show the ratio of market capitalization of a project’s native token to the number of users on the platform over the trailing one-year period.


As a general observation, I was initially taken aback by a few things.
First, I expected the market capitalization per annualized user curve to look exactly the opposite. I expected that valuations would be bloated in the early stages of the ecosystem, given sky-high valuations and low user counts, and then eventually come down as more users came in.
Second, the shape of the Decentraland and The Sandbox charts looked eerily similar (aside from the user spikes in the The Sandbox chart), as if one were drawn from memory of the other. These two projects, however, are viewed somewhat as substitute products, like Coca-Cola and Pepsi, so perhaps that isn’t quite so surprising.
Read More: How to Invest in the Metaverse
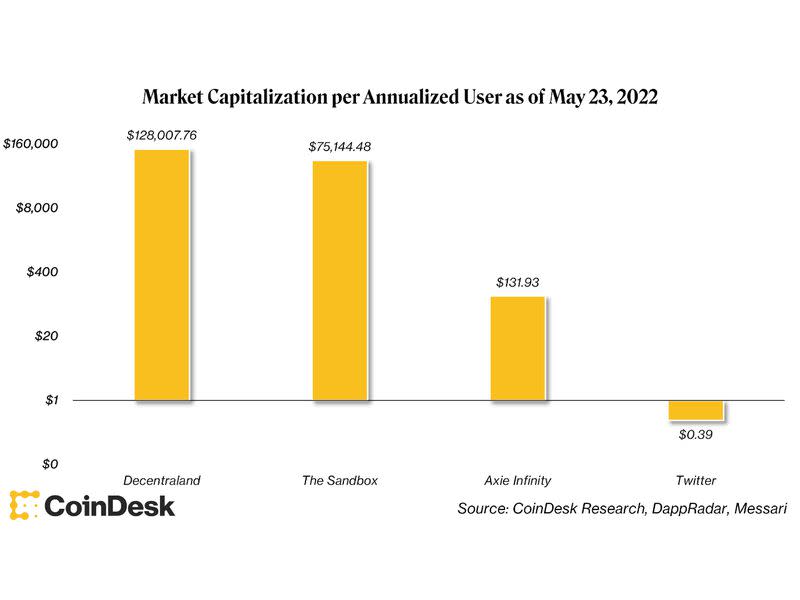
Lastly, Axie Infinity had far more users than either Decentraland or The Sandbox, but its market capitalization per user multiple was far lower. Granted, Axie Infinity is a play-to-earn game rather than a “decentralized metaverse” but the contrast was still striking.
Disclaimer: The answer to ‘What does this mean?’ might be ‘nothing’
It’s worth noting that this valuation technique might be suspect, a nothingburger rooted in quicksand. Using a project’s annualized user count and comparing it to its market capitalization was an attempt to determine how much value the market was ascribing per user on each platform. From there, someone could look at this metric across projects and look at relative valuations and determine if something is deserving of the valuation the market is giving it. This could provide a pivot point for comparative purposes, but there’s nothing guaranteeing that it is the correct pivot point.
This valuation technique is also rife with assumptions. The metric assumes (a) that the market knows what it’s doing and (b) that these projects should have any value at all. It also doesn’t take into consideration the possibility that the same individuals could have multiple accounts on a platform, which would overstate the user count. The assumption here is also that this is the right usage metric to look at; perhaps it is more fitting to look at transactions on the platform (which were not much different than users, for the record, but at least those are unique; see below for Decentraland per-transaction data). Maybe it was more appropriate to look at something more nuanced that I failed to uncover.

Lastly, I also admit to my own personal skepticism in the metaverse in general. I wouldn’t call myself a metaverse believer, so there’s a chance some of my preconceptions nudged the analysis toward more unflattering metrics. Strengthening my skepticism is the following very rough math and equivalence: Twitter, an app beloved by crypto natives, boasts over 200 million daily active users. Twitter’s market capitalization is around $29 billion as of May 23, 2022. If we apply the lowest market capitalization per annualized user presented in any of these charts (Axie Infinity, $118 per user) that would imply a more than $8.5 trillion valuation for Twitter.
Call me skeptical, but that number seems quite high.

More from Metaverse Week:
How the Metaverse Could Be a Game-Changer for NFT Gaming
Rather than letting players port weapons or powers between games, non-fungible tokens will more likely serve as building blocks for new games and virtual worlds.
The Metaverse Will Make Gamers of Us All
Fundamentally, the "metaverse" is a game – but one with real consequences and opportunities.
What Can You Actually Do in the Metaverse in 2022?
The future possibilities of the metaverse are presumably limitless, but is there anything you can do in the metaverse right now?

 Yahoo Movies
