
 Yahoo Movies
 Are Trinity Exploration & Production plc's (LON:TRIN) Mixed Financials The Reason For Its Gloomy Performance on The Stock Market?
With its stock down 7.2% over the past month, it is easy to disregard Trinity Exploration & Production (LON:TRIN). It seems that the market might have completely ignored the positive aspects of the company's fundamentals and decided to weigh-in more on the negative aspects. Long-term fundamentals are usually what drive market outcomes, so it's worth paying close attention. Specifically, we decided to study Trinity Exploration & Production's ROE in this article.
Return on Equity or ROE is a test of how effectively a company is growing its value and managing investors’ money. In short, ROE shows the profit each dollar generates with respect to its shareholder investments.
View our latest analysis for Trinity Exploration & Production
How Do You Calculate Return On Equity?
The formula for return on equity is:
Return on Equity = Net Profit (from continuing operations) ÷ Shareholders' Equity
So, based on the above formula, the ROE for Trinity Exploration & Production is:
0.9% = US$440k ÷ US$50m (Based on the trailing twelve months to December 2021).
The 'return' is the income the business earned over the last year. Another way to think of that is that for every £1 worth of equity, the company was able to earn £0.01 in profit.
What Has ROE Got To Do With Earnings Growth?
We have already established that ROE serves as an efficient profit-generating gauge for a company's future earnings. We now need to evaluate how much profit the company reinvests or "retains" for future growth which then gives us an idea about the growth potential of the company. Assuming everything else remains unchanged, the higher the ROE and profit retention, the higher the growth rate of a company compared to companies that don't necessarily bear these characteristics.
Trinity Exploration & Production's Earnings Growth And 0.9% ROE
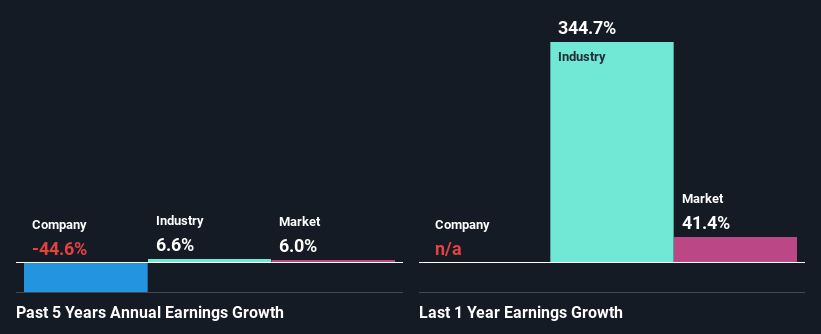
It is hard to argue that Trinity Exploration & Production's ROE is much good in and of itself. Even compared to the average industry ROE of 15%, the company's ROE is quite dismal. Therefore, it might not be wrong to say that the five year net income decline of 45% seen by Trinity Exploration & Production was possibly a result of it having a lower ROE. However, there could also be other factors causing the earnings to decline. For example, the business has allocated capital poorly, or that the company has a very high payout ratio.
So, as a next step, we compared Trinity Exploration & Production's performance against the industry and were disappointed to discover that while the company has been shrinking its earnings, the industry has been growing its earnings at a rate of 6.6% in the same period.
Earnings growth is a huge factor in stock valuation. What investors need to determine next is if the expected earnings growth, or the lack of it, is already built into the share price. By doing so, they will have an idea if the stock is headed into clear blue waters or if swampy waters await. One good indicator of expected earnings growth is the P/E ratio which determines the price the market is willing to pay for a stock based on its earnings prospects. So, you may want to check if Trinity Exploration & Production is trading on a high P/E or a low P/E, relative to its industry.
Is Trinity Exploration & Production Efficiently Re-investing Its Profits?
Trinity Exploration & Production doesn't pay any dividend, meaning that the company is keeping all of its profits, which makes us wonder why it is retaining its earnings if it can't use them to grow its business. So there could be some other explanations in that regard. For instance, the company's business may be deteriorating.
Summary
Overall, we have mixed feelings about Trinity Exploration & Production. While the company does have a high rate of reinvestment, the low ROE means that all that reinvestment is not reaping any benefit to its investors, and moreover, its having a negative impact on the earnings growth. Wrapping up, we would proceed with caution with this company and one way of doing that would be to look at the risk profile of the business. To know the 2 risks we have identified for Trinity Exploration & Production visit our risks dashboard for free.
Have feedback on this article? Concerned about the content? Get in touch with us directly. Alternatively, email editorial-team (at) simplywallst.com.
This article by Simply Wall St is general in nature. We provide commentary based on historical data and analyst forecasts only using an unbiased methodology and our articles are not intended to be financial advice. It does not constitute a recommendation to buy or sell any stock, and does not take account of your objectives, or your financial situation. We aim to bring you long-term focused analysis driven by fundamental data. Note that our analysis may not factor in the latest price-sensitive company announcements or qualitative material. Simply Wall St has no position in any stocks mentioned.

