
 Yahoo Movies
 Thor Explorations Announces Third Quarter 2022 Financial and Operating Results, for the Three and Nine Months Ending September 30, 2022
This Announcement contains inside information as defined in Article 7 of the Market Abuse Regulation No. 596/2014 ("MAR"). Upon the publication of this Announcement, this inside information is now considered to be in the public domain.
Vancouver, British Columbia--(Newsfile Corp. - November 30, 2022) - Thor Explorations Ltd. (TSXV: THX) (AIM: THX) ("Thor Explorations" or the "Company") is pleased to provide an operational and financial review for its mineral properties located in Nigeria, Senegal and Burkina Faso for the three (the "Quarter" or "Q3") and nine months to September 30, 2022 (the "Period").
The Company's Condensed Consolidated Interim Financial Statements together with the notes related thereto, as well as the Management's Discussion and Analysis for the three and nine months ended September 30, 2022, are available on Thor Explorations' website:
https://thorexpl.com/investors/financials/
Operational Highlights of the Quarter and the Period
Gold production of 26,523 ounces ("oz") for the Quarter and of 71,651oz for the Period at the Segilola Gold mine, located in Nigeria ("Segilola")
Average mill feed grade during the Quarter was 3.58 grammes per tonne ("g/t") and recovery was 95.5%
28,787oz of gold and 1,931oz of silver sold in the Quarter, and 67,617oz of gold and 4,204oz of silver sold in the Period
Gold dore inventory of 2,226oz at the end of the Quarter
Acquisition of additional exploration licences in Osun State and Kwara State, Nigeria
Entered into a Joint Venture ("JV") agreement over a further exploration licence in Kwara State, Nigeria
Exploration during the Quarter:
An initial 1,280 metres of reverse circulation ("RC") and diamond drilling was carried out at Segilola
At Douta, a RC drilling programme together with a target-generation termite geochemistry programme occurred to test the Makosa East soil geochemistry anomaly
A total of 824 metres of RC drilling at the Sambara prospect at Douta was completed. Gold mineralisation was discovered over approximately 500m of strike
13 corporate governance policies were either implemented or updated during the Quarter
The Company continues to fund a range of livelihood restoration programmes, including preparing sites for fish farms and for vegetable nursery farms
Community development programmes included Youth Initiative and Women's Initiative programmes focusing on practical skill-based courses and annual school scholarship awards
Financial Highlights of the Quarter and the Period
Gold sales generated revenue for the Quarter of US$55.7 million and US$121.9 million for the Period
Net profit of US$4.1 million for the Quarter and US$10.4 million for the Period
All in sustaining cost ("AISC") of US$986 per oz for the Quarter and US$909 per oz for the Period
As of September 30, 2022 the Company had cash of US$2.4 million
As of September 30, 2022 the Company had Net Debt of US$40.7 million (Q2 2022: US$47.4 million)
US$10.3 million of Senior Debt Facility repaid reducing Senior Debt Facility to US$28.9 million
EBITDA of US$14.1 million for the Quarter and US$41.2 million for the Period
Post Period Highlights
A full transition from diesel to six megawatt ("MW") compressed natural gas generators was completed, reducing Greenhouse Gas Emissions ("GHG") by 53%
Outlook
Production guidance for 2022 of 90,000 to 100,000oz of gold
Drilling programmes to resume in Q1 2023 at the Segilola Open Pit
Continuing to advance the Douta project towards a preliminary feasibility study ("PFS")
Continued exploration programmes across Segilola and Douta projects
Segun Lawson, President & CEO, stated:
"This has been another outstanding Quarter for the Company. Over the Period the Segilola mine has continued to produce at a steady rate, with the Company increasing production guidance twice over the last nine months. I am grateful for the dedication and hard work shown by the team at site during this Quarter and across the rainy season to keep production steady.
"Proudly and notably, the Company repaid another large sum of its Senior Debt Facility in the Period, having now reduced the facility by almost half since commercial production commenced.
"The exploration programmes upcoming across our portfolio provide great potential for the Company and I am positive that we have the teams, both managerial and on the ground, to realise the full potential of each project.
"Our relationship with the communities surrounding Segilola remains strong, whilst we continue to develop the project and explore the surrounding areas it is important to also develop the local communities and bring equal benefit to the region.
"I look forward to provide more updates in the future on Thor's exciting portfolio."
Further details can be found on the Company's website: www.thorexpl.com
About Thor Explorations
Thor Explorations Ltd. is a mineral exploration company engaged in the acquisition, exploration, development and production of mineral properties located in Nigeria, Senegal and Burkina Faso. Thor Explorations holds a 100% interest in the Segilola Gold Project located in Osun State, Nigeria and has a 70% economic interest in the Douta Gold Project located in south-eastern Senegal. Thor Explorations trades on AIM and the TSX Venture Exchange under the symbol "THX".
THOR EXPLORATIONS LTD.
Segun Lawson
President & CEO
For further information please contact:
Thor Explorations Ltd
Email: info@thorexpl.com
Canaccord Genuity (Nominated Adviser & Broker)
Henry Fitzgerald-O'Connor / James Asensio / Thomas Diehl
Tel: +44 (0) 20 7523 8000
Hannam & Partners (Broker)
Andrew Chubb / Matt Hasson / Nilesh Patel / Franck Nganou
Tel: +44 (0) 20 7907 8500
Fig House Communications (Investor Relations)
Tel: +1 416 822 6483
Email: investor.relations@thorexpl.com
BlytheRay (Financial PR)
Tim Blythe / Megan Ray / Rachael Brooks
Tel: +44 207 138 3203
Q3 2022 Operational Review
Segilola Project, Nigeria
During the Period, there continued to be global supply chain issues resulting in shortages and increased prices for a number of essential consumables and supplies such as ammonium nitrate, diesel and spare parts. The Company has mitigated these risks through the bulk purchase of most supply chain items and anticipates that its production guidance and costs for the year remain in line.
Gold Production
During the three months ended September 30, 2022 the Segilola Mine produced 26,523 ounces of gold (Q2 2022: 23,785 ounces).
The Company exported the gold regularly throughout the Quarter selling 28,787 ounces of gold and 1,913 ounces of silver and had a further gold dore inventory of 2,226 ounces on hand. These ounces have all been sold in the fourth quarter of 2022.
Mining
During the three months ended September 30, 2022, 4,018,431 tonnes of material was mined, equivalent to mining rates of 44,649 tonnes of material per day. In this period, 225,182 tonnes of ore were mined, equivalent to mining rates of 2,475 tonnes of ore per day, at an average grade of 4.43g/t.
The stockpile balance at the end of the period was 229,909 tonnes of ore at an average of 1.19g/t. This comprised 406 tonnes (5.80g/t) at high grade, 2,028 tonnes (2.87g/t) at medium grade, and 227,475 tonnes (1.12g/t) at low grade.
Processing
During the three months ended September 30, 2022, a total of 241,434 tonnes of ore, equivalent to a throughput rate of 2,682 tonnes per day, was processed.
The mill feed grade was 3.58g/t gold and recovery was 95.5% for a total of 26,523 ounces of gold produced. The Company continues to review the process plant to optimize throughput and recoveries.
All of the main operating units of the process plant are performing as expected, and the plant is consistently operating above nameplate capacity. The Company continues to carry out further optimization activities for the gold recovery process.
Production Metrics
Units | Q3 2022 | Q2 2022 | Q1 2022 |
| ||||||
Mining |
| |||||||||
Total Ore Mined | Tonnes | 225,182 | 284,079 | 226,314 | ||||||
Ore Processed | Tonnes | 241,434 | 211,582 | 221,900 | ||||||
Ore Stockpiled | Tonnes | 229,909 | 249,281 | 179,758 | ||||||
Waste Mined | Tonnes | 3,793,249 | 3,747,504 | 3,533,610 | ||||||
Total Mined | Tonnes | 4,018,431 | 4,031,584 | 3,759,524 | ||||||
Total Ore Mined Gold Grade | g/t Au | 4.43 | 3.63 | 2.68 | ||||||
Ore Processed | g/t Au | 3.58 | 3.66 | 3.18 | ||||||
Ore Stockpiled | g/t Au | 1.19 | 1.46 | 1.23 | ||||||
|
|
| ||||||||
Processing |
|
|
|
| ||||||
Ore Milled | Tonnes | 241,434 | 211,583 | 221,920 | ||||||
Daily Throughput Rate (average) | Tpd | 2,835 | 2,784 | 2,760 | ||||||
Daily Throughput/ Nameplate | % | 138% | 141% | 128% | ||||||
Capacity |
|
|
| |||||||
|
|
|
| |||||||
Ore Processed Gold Grade |
|
|
|
| ||||||
Recovery | % | 95.5 | 95.5 | 94.1 | ||||||
Gold Recovered | Oz | 26,523 | 23,785 | 21,343 |
|
Environment and Social Summary Q3 2022
The main focus with respect to the Company's environment and social activities for Q3 2022 was implementing its new governance policies (13 new and/or updated policies) which included finalising the contract for an independent and free whistle blower hotline. Thor's 2021 Sustainability Report was further progressed, and metrics devised for measuring implementation of key sustainability parameters across the material topics of Corporate Governance, People, Health and Safety, Social and Community Development, Cultural Governance and Environment. The report will be completed in Q4 2022. The Company has agreed to use the Global Reporting Initiative's (GRI) ESG reporting standards including the recently released Mining and Metals Sector disclosure standards for Thor's 2022 Sustainability and ESG Report.
During Q3 2022, significant progress has been made for the Company's wholly owned operating subsidiary, Segilola Resources Operating Limited ("SROL") to attain its' ISO 45001 Health and Safety accreditation with a site audit completed and agreement on actions to close out over the next 12 months. Accreditation is expected in Q4 2023. SROL's General Manager, Mike Kelly, received the Safety Ambassador Award from the Institute of Safety Professionals Nigeria (August 2022). This award from health and safety peers is a professional acknowledgement of the high safety standards implemented at the Segilola project.
A full transition from diesel to 6 MW compressed natural gas ("CNG") generators will reduce GHG by 53% over that generated by diesel generators. This is a key step in SROL's reduction of its carbon footprint. This transition was completed post the period.

HSE statistics to end Q3 2022
To view an enhanced version of this table, please visit:
https://images.newsfilecorp.com/files/7003/146148_thorfigure1.jpg
An Environmental Impact Assessment for a helipad within the existing Segilola Mine site has been submitted to Federal Ministry of Environment and is expected to be approved in Q1 2023.
Social and community development parameters for the Segilola Project were also progressed in Q3 2022. Focus has been on establishing livelihood restoration projects by preparing sites for the fish farms (construction expected in Q1 2023) and site clearance for the vegetable farms' nursery. Contracts have been awarded to local companies for the construction of both livelihood projects. Specialist agricultural assistance from Nigerian experts has been contracted in by SROL to assist with implementation during the next 12 month period to enable the projects' community operators to become self-sufficient and financially viable within the next 12 to 18 months.
Through funding agreed via Community Development Agreements ("CDA") signed with the three communities surrounding the Segilola Mine, community programmes were progressed in Q3 2022. These included Youth Initiative and Women's Initiative programmes focusing on practical skill-based courses - truck driver training, mobile phone repairs and value-added production equipment. Annual school scholarship awards to enable children from vulnerable backgrounds to remain in school, are progressing with testing and interviews completed. Recipients will be selected in Q4 2022.
Compensation for temporary loss of assets and lands impacted by exploration activities (at 13 explorations sites across three states in Nigeria) stands at $354,000 for 585 asset owners and 15 landowners (as of end of Q3 2022).
Social listening continues (monitoring SROL and Thor mentions in Nigerian media) across electronic, TV and printed media and findings are shared with key departments in SROL. Most media coverage has been positive.
In Senegal, exploration activities at the Douta Project have progressed throughout Q3 2022. The project has now appointed a HSE officer with HSE leading and lagging indicators being recorded. A site waste plan has been implemented and waste generated from the drill site and camp is stored in separate bins of biodegradable and non-biodegradable. Biodegradable such as paper, sample bags and food are burned. Non-biodegradable such as cans, and empty water bottles are given to the local population for recovery or recycling. Used oils are stored in a well-defined place pending delivery to specialised companies for disposal. The HSE officer has formalized the sale of metal waste and the money from this sale is paid into the company's social fund for community projects.
Exploration Activity Summary Q3 2022
Nigeria
Introduction
The high grade Segilola gold deposit is located on the major regional shear zone that extends for several hundred kilometres through the gold-bearing Ilesha schist belt (structural corridor) of Nigeria.
Thor's exploration tenure comprises 11 wholly owned explorations licences and four joint ventures. Together with the mining lease over the Segilola Gold Deposit, Thor's total exploration tenure amounts to over 1,400 km2.
Exploration Activity
In the Quarter, the Company increased its exploration footprint in Nigeria via the acquisition of additional exploration licences in Osun State and Kwara State and also entered into a joint venture agreement over a further exploration licence in Kwara state.
The Company's licence portfolio now consists of 17 exploration licences and the Segilola mining licence.

Figure 1: Thor Explorations/ Segilola Licence Portfolio Map
To view an enhanced version of Figure 1, please visit:
https://images.newsfilecorp.com/files/7003/146148_9a342f21642109a9_003full.jpg
Exploration during the Quarter consisted of an initial 1,280 metres of reverse circulation ("RC") and diamond drilling. In addition to the drilling programme, the Company prioritised the generation of drilling targets, with a focus on targets within trucking distance of the Segilola plant. Exploration activities comprised of soil and stream geochemical surveys, auger drilling, trenching and ground magnetic programmes.
The areas drilled were north of the Segilola Open Pit and at the "Ijana" and "Esteedan" targets which are located 14km to the west of Segilola. The main objectives of this programme are:
To test the geochemical and structural targets generated by auger soil sampling and trenching in EL 20776 and EL23573 also the drilling was targeting the occurrence of gold mined in shallow pits mined by artisanal.
To test the gold-in soil anomalies generated by auger soil and trench sampling at Odo within EL19066, 3km north of Segilola deposit.
The drilling programmes are scheduled to resume in January following the receipt of all assay results and completion of drill target generation work.
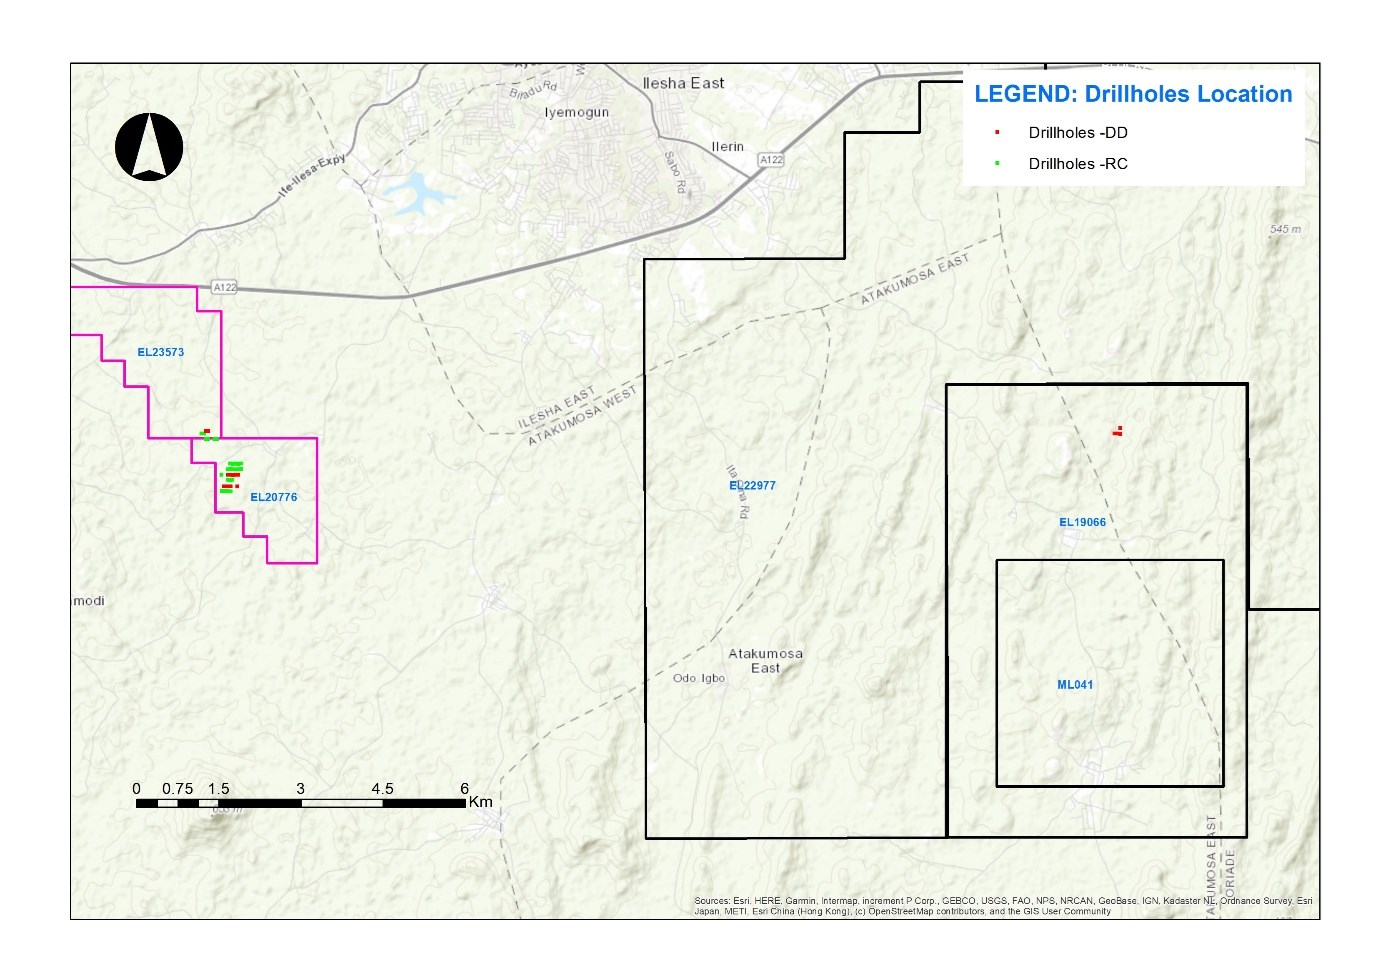
Figure 2: Map Showing Drilling Programme Locations
To view an enhanced version of Figure 2, please visit:
https://images.newsfilecorp.com/files/7003/146148_9a342f21642109a9_004full.jpg

Figure 3: Drill Targets Generated on the Company's portfolio
To view an enhanced version of Figure 3, please visit:
https://images.newsfilecorp.com/files/7003/146148_9a342f21642109a9_005full.jpg
Senegal
Introduction
The Douta Gold Project is a gold exploration permit, E02038, which covers an area of 58km2 and is located within the Kéniéba inlier, eastern Senegal. The northeast-trending licence (Figure 4) has an area of 58 km2. Thor, through its wholly owned subsidiary African Star Resources Incorporated ("African Star"), has a 70% economic interest in partnership with the permit holder International Mining Company SARL ("IMC"). IMC has a 30% free carried interest in its development until the announcement by Thor of a Probable Reserve.
The Douta licence is strategically positioned 4km east of Massawa North and Massawa Central deposits, which form part of the world-class Sabadola-Massawa Project owned by Endeavour Mining (Figure 4). The Makabingui deposit, belonging to Bassari Resources Ltd, is immediately located east of the northern portion of E02038.
There is an initial resource estimate of 15 million tonnes ("Mt") grading 1.53g/t Au for 730,000oz gold in the Inferred category. The resource encompasses the Makosa, Makosa North and Makosa Tail zones, which are collectively named the Makosa Resource.

Figure 4: Douta Project Location Map
To view an enhanced version of Figure 4, please visit:
https://images.newsfilecorp.com/files/7003/146148_9a342f21642109a9_006full.jpg
Exploration Activity
During the Quarter, the main exploration work comprised the RC drilling programme together with a target-generation termite geochemistry programme occurred to test the Makosa East soil geochemistry anomaly.
Tables 5 and 6 summarise the exploration statistics for the Quarter.
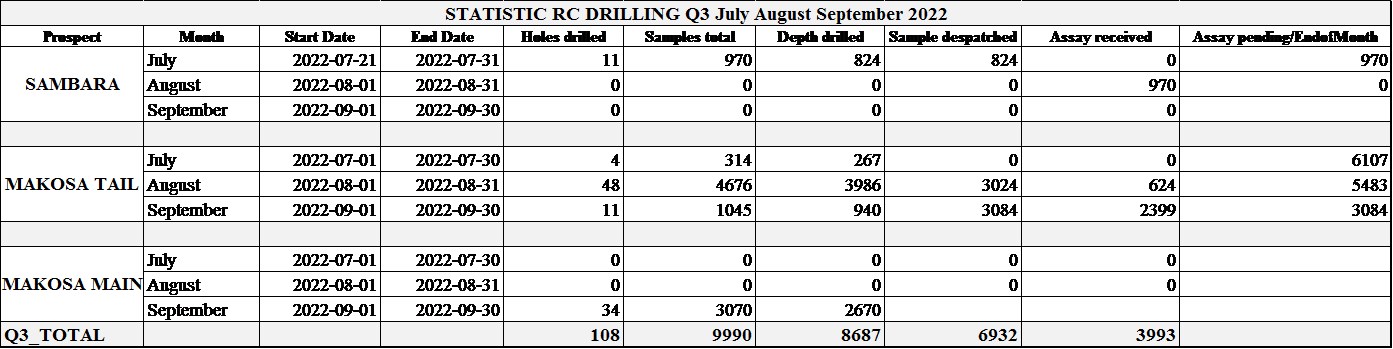
Table 5: Douta Drilling Statistics
To view an enhanced version of this table, please visit:
https://images.newsfilecorp.com/files/7003/146148_9a342f21642109a9_007full.jpg
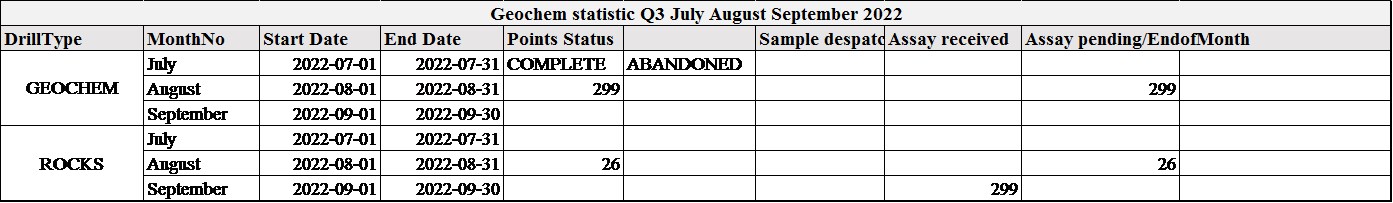
Table 6: Douta Geochemistry statistics
To view an enhanced version of this table, please visit:
https://images.newsfilecorp.com/files/7003/146148_9a342f21642109a9_008full.jpg
Exploration Results
Sambara
The Sambara Prospect is located 15km north-east along strike from the Makosa resource (Figure 5). Drilling targeted an anomalous zone defined by auger geochemical sampling. The area is located 2km directly north of the Makabingui group gold deposits and which collectively contain approximately 340,000oz gold in the indicated category and 670,000oz gold in the inferred category.
Drill testing of the geochemical anomaly was carried out over nine sections that were spaced at either 100m or 200m apart (Figure 5). This wide spacing was considered to be appropriate for the first phase of drill testing. Based on the positive results received, additional, closer-spaced (infill) drilling will be undertaken.
A total of 824m of RC drilling at the Sambara prospect was completed. Gold mineralisation was discovered over approximately 500m of strike. The host rock is deformed greywacke associated with smoky quartz, disseminated pyrite, sericite, and silica stockworks.
Table 7 summarises the significant results from the Sambara drilling programme.
HOLE-ID | X | Y | Z | Depth | Azimuth | Dip | From | To | Interval | Grade (g/tAu) | True Width |
DTRC426 | 187999 | 1451958 | 146 | 72 | 130 | -50 | 65 | 71 | 6 | 4.80 | 2.5 |
Incl | 70 | 71 | 1 | 0.80 | 0.9 | ||||||
DTRC431 | 188165 | 1452076 | 150 | 84 | 130 | -50 | 12 | 18 | 6 | 4.80 | 3.6 |
DTRC491 | 188174 | 1452068 | 160 | 42 | 130 | -60 | 8 | 10 | 2 | 6.39 | 1.3 |
DTRC492 | 188155 | 1452081 | 160 | 60 | 130 | -60 | 23 | 26 | 3 | 1.64 | 1.9 |
DTRC493 | 188146 | 1452093 | 160 | 96 | 130 | -60 | 10 | 11 | 1 | 3.33 | 0.6 |
And | 41 | 42 | 1 | 2.53 | 0.6 | ||||||
And | 57 | 63 | 6 | 2.58 | 3.7 | ||||||
Includes | 59 | 63 | 4 | 3.32 | 2.3 | ||||||
DTRC496 | 188230 | 1452156 | 145 | 70 | 130 | -60 | 8 | 13 | 5 | 1.12 | 3.2 |
DTRC497 | 188094 | 1452008 | 158 | 45 | 130 | -60 | 15 | 20 | 5 | 1.74 | 3.1 |
DTRC497 | 130 | -60 | 26 | 28 | 2 | 5.85 | 1.2 | ||||
DTRC498 | 188080 | 1452020 | 163 | 90 | 130 | -60 | 17 | 22 | 5 | 0.55 | 3.2 |
And | 29 | 34 | 5 | 1.07 | 3.2 | ||||||
And | 60 | 61 | 1 | 4.72 | 0.6 |
Table 7: Sambara Significant Results

Figure 5: Sambara Drillhole Location Map
To view an enhanced version of Figure 5, please visit:
https://images.newsfilecorp.com/files/7003/146148_9a342f21642109a9_009full.jpg
Makosa
The Makosa resource is currently classified as inferred. In August 2022, Thor commenced a programme of follow up RC and diamond drilling with the objective of upgrading the higher-grade portions of the resource, that fall within the optimised pit shell, to indicated classification.
Initial results from drillholes completed at the southern extremity of the deposit include 8m at 4.77g/t gold from 62m in drillhole DTRC504 (Figure 6). The significant intersections from Makosa are listed in Table 8. In addition to upgrading this part of the resource, the intersection suggests that gold mineralisation may extend to depth. Two additional drillholes (DTRC561 and DTRC562) have subsequently been drilled to test for depth extensions to this higher grade zone. Assays for these two holes are pending.
HOLE-ID | X | Y | Z | Length | Azimuth | Dip | From | To | Interval | Grade | True |
DTRC502 | 173909 | 1433683 | 198 | 70 | 130 | -60 | 45 | 52 | 7 | 1.11 | 4.6 |
DTRC504 | 173926 | 1433729 | 155 | 80 | 130 | -60 | 47 | 50 | 3 | 1.48 | 1.9 |
and | 62 | 70 | 8 | 4.77 | 5.1 | ||||||
DTRC505 | 173877 | 1433642 | 155 | 72 | 130 | -60 | 34 | 39 | 5 | 1.92 | 3.1 |
and | 53 | 60 | 7 | 0.60 | 4.4 | ||||||
DTRC506 | 173898 | 1433630 | 200 | 30 | 130 | -60 | 1 | 5 | 4 | 2.95 | 2.5 |
includes | 1 | 4 | 3 | 3.29 | 1.8 | ||||||
DTRC508 | 174264 | 1434389 | 190 | 60 | 130 | -60 | 19 | 21 | 2 | 3.12 | 1.2 |
and | 47 | 53 | 6 | 0.51 | 3.7 | ||||||
DTRC509 | 174304 | 1434427 | 190 | 42 | 130 | -60 | 38 | 40 | 2 | 2.84 | 1.2 |
Table 8: Makosa Significant Results
(0.5g/tAu lower cut off; maximum 2m internal dilution, minimum 2m interval)
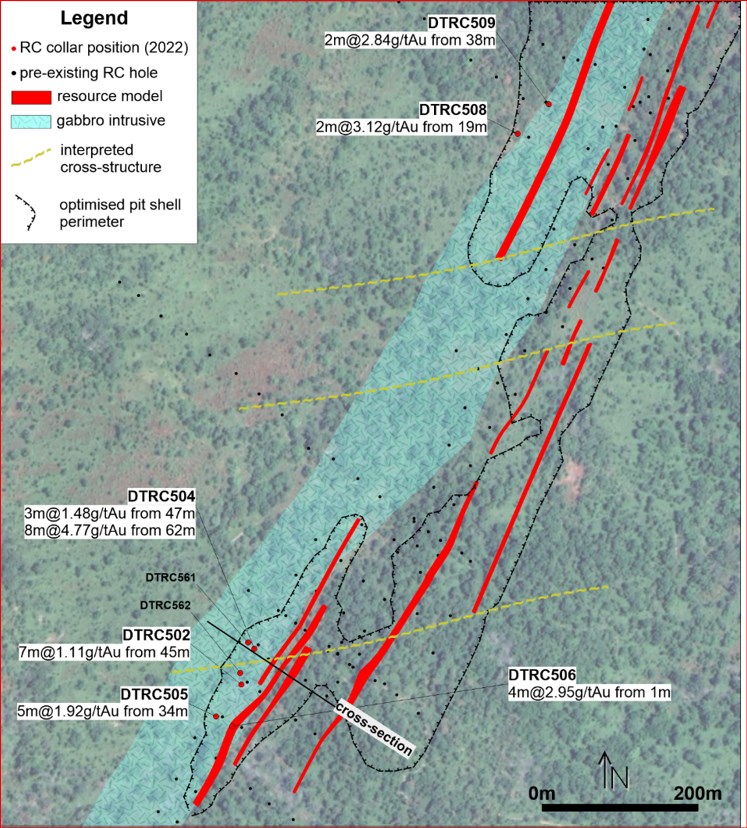
Figure 6: Makosa Drillhole Location Map
To view an enhanced version of Figure 6, please visit:
https://images.newsfilecorp.com/files/7003/146148_9a342f21642109a9_010full.jpg
At Makosa, zones of gold mineralisation are developed either within a sheared gabbro intrusive or within a steep north-westerly dipping sequence of meta-sedimentary rocks that are close proximity to the gabbro (Figure 7). Higher grade zones or shoots are suspected to occur along east-west oriented structures that cut across the main north-east trend of the mineralisation. The potential to upgrade the resource will be assessed by ongoing infill drilling along the Makosa mineralised trend.

Figure 7: Makosa Cross Section
To view an enhanced version of Figure 7, please visit:
https://images.newsfilecorp.com/files/7003/146148_9a342f21642109a9_011full.jpg
Hounde Gold Project, Burkina Faso
No exploration activities took place during the Quarter.
SUBSEQUENT EVENTS
There are no material subsequent events to report.
OUTLOOK AND UPCOMING MILESTONES
This Section 5 of the MD&A contains forward looking information as defined by National Instrument 51-102. Refer to Section 16 of this MD&A for further information on forward looking statements. |
We are focussed on advancing the Company's strategic objectives and near-term milestones which include:
Maintain our rigorous health and safety protocols
2022 Operational Guidance and Outlook
Gold Production | oz | 90,000-100,000 |
All-in Sustaining Cost ("AISC") | US$/oz Au sold | $850 - $950 |
Capital Expenditure 1 | US$ | 23,500,000 |
Exploration Expenditure: | ||
Nigeria 2 | US$ | 4,200,000 |
Senegal | US$ | 3,000,000 |
1 The increase in guidance from Q2 is due to the additional provision for the EPC contract ($9m), and purchase of additional mining equipment ($4.5m) not included in previous guidance.
2 This includes purchase of licenses and near mine exploration
The critical factors that influence whether Segilola can achieve these targets include:
Segilola's ability to maintain an adequate supply of consumables (in particular ammonium nitrate, flux and cyanide) and equipment, particularly if there is any resurgence in the COVID-19 pandemic
Fluctuations in the price of key consumables, in particular ammonium nitrate, and diesel
Segilola's workforce remaining healthy
Continuing to receive full and on-time payment for gold sales
Continuing to be able to make local and international payments in the ordinary course of business
Continue to advance the Douta project towards preliminary feasibility study ("PFS")
Continue to advance exploration programmes across the portfolio:
Segilola near mine exploration
Segilola underground project
Segilola regional exploration programme
Douta extension programme
Douta infill programme
Assess regional potential targets in Nigeria
SUMMARY OF QUARTERLY RESULTS
The table below sets forth selected results of operations for the Company's eight most recently completed quarters.
Summary of quarterly results
$ | 2022 Q3 | 2022 Q2 | 2022 Q1 | 2021 Q4 |
| |||||||
Revenues | 55,703,098 | 41,354,747 | 24,865,482 | 6,205,345 |
| |||||||
Net profit/(loss) for period | 4,126,066 | 6,163,942 | 200,473 | 2,665,653 |
| |||||||
Basic and fully diluted profit/(loss) per share (cents) | 0.016 | 0.01 | 0.00 | 0.40 |
|
$ | 2021 Q3 | 2021 Q2 | 2021 Q1 | 2020 Q4 | | |||||||
Revenues | - | - | - | - | ||||||||
Net profit/(loss) for period | 463,844 | (5,582,090 | ) | (67,365 | ) | (1,560,694 | ) | |||||
Basic and fully diluted profit/(loss) per share (cents) | (0.001 | ) | (0.90 | ) | (0.05 | ) | (0.25 | ) |
NON-IFRS MEASURES
This MD&A refers to certain financial measures, such as average realized gold price, which are not recognized under IFRS and do not have a standardized meaning prescribed by IFRS. These measures may differ from those made by other companies and accordingly may not be comparable to such measures as reported by other companies. These measures have been derived from the Company's financial statements because the Company believes that, with the achievement of gold production, they are of assistance in the understanding of the results of operations and its financial position.
Average realised gold price per ounce sold
Average realized gold price is a metric used to better understand the gold price realized during a period. This is calculated as sales less treatment and refining charges, and sales agreement costs divided by gold oz sold.
Average annual realised price per ounce sold
Units | Nine months | Three months | Three months | Three months |
| ||||||||
Revenues 1 | $ | 121,923,327 | 55,703,098 | 41,354,747 | 24,865,482 | ||||||||
Deferred Income 2 | $ | - | - | - | 6,233,347 | ||||||||
Gold Sales | $ | 121,923,327 | 55,703,098 | 41,354,747 | 31,098,829 |
| |||||||
|
|
|
|
| |||||||||
Gold ounces sold | oz Au | 67,617 | 28,787 | 22,172 | 16,658 |
| |||||||
Average realised price per ounce sold 3 | $ | 1,803.15 | 1,935.01 | 1,865.18 | 1,866.90 |
|
1 Included in Revenues is sales of silver, which is a produced and sold as a by-product, and is not material to the calculation.
2 Deferred income relates to 3,196 ounces of gold sales that were in transit as at March 31 2022.
3 Impact of deferred income ounces rolled forward into three months to September 30,2022, regularized at nine months to September 30, 2022
Cash operating cost per ounce
Cash operating cost per oz sold, combined with revenues, can be used to evaluate the Company's performance and ability to generate operating income and cash flow from operating activities.
Average annual cash operating cost per ounce of gold
Nine months | Three months | Three months | Three months |
| |||||||||||
Operating expenses | $ | 47,012,448 | 17,912,146 | 19,486,150 | 8,356,121 |
| |||||||||
Expenses relating to deferred income 1 | $ | - | - | - | 2,681,819 |
| |||||||||
Royalty expenses | $ | 2,379,110 | 882,093 | 946,252 | 550,765 |
| |||||||||
Cash Operating costs | $ | 49,391,558 | 18,794,239 | 20,432,402 | 11,588,705 |
| |||||||||
|
|
|
|
| |||||||||||
Gold ounces sold recognised in income statement | Oz Au | 67,617 | 28,787 | 22,172 | 16,658 |
| |||||||||
Cash operating cost per ounce sold | $/oz | 730 | 653 | 922 | 771 |
| |||||||||
1 Deferred income relates to 3,196 ounces of gold sales that were in transit as at March 31 2022.
All-in sustaining cost per ounce
AISC provides information on the total cost associated with producing gold since December 1, 2021 and has been calculated on a basis consistent with historic news releases by the Company.
The Company calculates AISC as the sum of total cash operating costs (as described above), corporate social responsibility costs, treatment and refining charges, accretion of restoration provision, and sustaining capital, less silver revenue, all divided by the gold ounces sold to arrive at a per oz amount.
Other companies may calculate this measure differently as a result of differences in underlying principles and policies applied.
Average annual all-in sustaining cost per ounce of gold
Nine months | Three months | Three months | Three months |
| |||||||||
Cash operating costs | $ | 49,391,558 | 18,794,239 | 20,432,402 | 8,356,121 |
| |||||||
Treatment and refining charges | $ | 2,447,485 | 1,340,272 | 604,691 | 502,522 |
| |||||||
Sustaining capital 1 | $ | 9,626,085 | 8,246,912 | 160,896 | 1,218,277 |
| |||||||
Total all-in sustaining cost | $ | 61,465,128 | 28,381,423 | 21,197,989 | 13,309,204 |
| |||||||
|
|
|
|
| |||||||||
Gold ounces sold | oz Au | 67,617 | 28,787 | 22,172 | 16,658 |
| |||||||
All-in sustaining cost per ounce sold | $/oz | 909 | 986 | 956 | 799 |
|
1 Sustaining capital for the three months to September 30, 2022 includes capital costs relating to the TMF project ($1.7m), workshop and building construction ($461,000), process plant and mining spares and equipment ($1.3m) and reallocated mine asset costs from Q1 and Q2 into Q3.
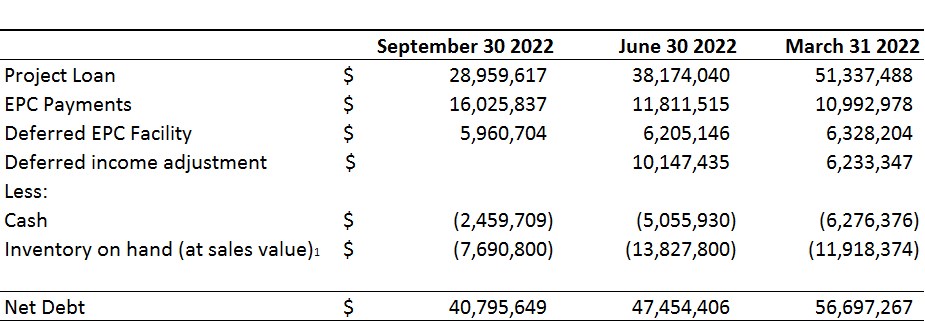
Net Debt
Net debt is calculated as total debt adjusted for unamortized deferred financing charges less cash and cash equivalents and short-term investments at the end of the reporting period. This measure is used by management to measure the Company's debt leverage. The Company considers that in addition to conventional measures prepared in accordance with IFRS, net debt is useful to evaluate the Company's performance.
Previous quarters contained a provision for outstanding EPC invoices of $5.2 million. Following a full audit, the EPC contractor presented and the Company has accepted, an additional late invoice of approximately $4 million. Total EPC Payments due have been confirmed at $16 million.
The Net Debt reported at June 30, 2022 and March 31, 2022 have been revised to include the deferred income component which was omitted from the Net Debt calculations. The revised figures are presented in the Table below. The figure reported for Net Debt in June 30, 2022 and March 31, 2022 was $37,306,971 and $50,463,920 respectively.
Net Debt
To view an enhanced version of this table, please visit:
https://images.newsfilecorp.com/files/7003/146148_9a342f21642109a9_012full.jpg
1 Includes gold dore held in inventory valued at $1,700/oz.
Earnings Before Interest, Taxes, Depreciation and Amortisation (EBITDA)
EBITDA is calculated as the total earnings before interest, taxes, depreciation and amortisation. This measure helps management assess the operating performance of each operating unit.
Earnings Before Interest, Tax, Depreciation and Amortization (EBITDA)
Nine months | Three months | Three months | Three months |
| |||||||||
Net profit for the period | $ | 10,431,167 | 4,126,066 | 6,104,628 | 200,473 |
| |||||||
|
|
|
|
| |||||||||
Amortisation and depreciation - owned assets | $ | 15,923,649 | 5,130,023 | 5,789,009 | 5,004,617 |
| |||||||
Amortisation and depreciation - right of use assets | $ | 3,477,995 | 1,244,005 | 1,075,735 | 1,158,255 |
| |||||||
Impairment of Exploration & Evaluation assets | $ | 9,581 | 2,360 | 4,520 | 2,701 |
| |||||||
Interest expense | $ | 11,351,690 | 3,657,827 | 3,935,732 | 3,758,131 |
| |||||||
EBITDA | $ | 41,194,082 | 14,160,281 | 16,909,624 | 10,124,177 |
| |||||||
|
|
|
|
| |||||||||
Ounces sold 1 | oz Au | 67,617 | 28,787 | 22,172 | 16,658 |
| |||||||
EBITDA per ounce sold | $ | 609 | 492 | 763 | 608 |
|
1 3,196 ounces of gold in transit at March 31, 2022 were adjusted for between Q1 and Q2 sales.
RESULTS FOR NINE MONTHS ENDED SEPTEMBER 30, 2022
The review of the results of operations should be read in conjunction with the Company's Consolidated Financial Statements and notes thereto.
The Company reported a net profit of $10,431,167 ($0.016 profit per share) for the nine months to September 30, 2022, as compared to a net loss of ($4,644,514 ($0.007 loss per share) for the nine months ended September 30, 2021. The move to profit for the nine months was largely due to:
Sales to Q3 2022 of $121,923,327 2021 (nil for 2021);
Foreign exchange gains of $8,043,758 from loss of $967,679 for the same period in 2021
These were offset partially by:
Amortisation and depreciation of $19,401,644; and
Interest of $11,351,690
The Company recorded sales revenue of $121,923,327 for the nine months ended September 30, 2022, and $nil for the nine months to September 30,2021. No interest was earned during the nine months ended September 30, 2022, and 2021.
LIQUIDITY AND CAPITAL RESOURCES
As at September 30, 2022, the Company had cash of $2,459,709, and 2,226 ounces of gold dore in inventory to be sold, and a working capital deficit of $35,592,984.
The increase in cash from December 31, 2021 (cash of $1,276,270) is due mainly to gold sales revenue of $121,923,327, offset by instalment payments on the loan facility of $27,388,729, the purchase of property plant and equipment of $9,575,425 and operational costs and corporate overheads of $89,111,233. This cash expenditure was financed by operational cashflow and existing cash balances.
The EPC Contractor has confirmed that it will continue to support the Company by extending the payment period of the final EPC invoices and has acknowledged that the Company will make payment of the final EPC invoices from available cashflow by the end of H1 2023.
Working Capital Calculation
The Working Capital Calculation excludes $9,891,530 of gold stream liabilities, and $3,492,023 in third party royalties included in current accounts payable, that are contingent upon the achievement of the revised gold sales forecast of 90,000-100,000 ounces for the year ending December 31, 2022.
Included in working capital, in Accounts payable and accrued liabilities, is a balance of $16,025,837 due to our EPC contractors. The EPC Contractor and the Company have agreed to make payment of the final EPC invoices from available cashflow before June 30, 2023.
Working Capital
September 30 | June 30 | March 31 |
| |||||||
Current Assets | ||||||||||
Cash and Restricted Cash | $ | 2,459,709 | 5,055,930 | 6,276,376 | ||||||
Inventory | $ | 11,581,051 | 24,046,025 | ) | 16,534,943 | ) | ||||
Amounts receivable, prepaid expenses, advances and deposits | $ | 3,758,295 | 2,667,106 | 1,110,095 |
| |||||
Total Current Assets for Working Capital | $ | 17,799,055 | 25,212,413 | 21,239,595 |
| |||||
|
|
| ||||||||
Current Liabilities |
|
|
| |||||||
Accounts Payable and accrued liabilities | $ | 48,670,354 | 39,128,410 | 31,834,095 | ||||||
Lease Liabilities | $ | 4,766,383 | 4,007,843 | 4,854,714 | ||||||
Gold Stream Liability | $ | 9,891,530 | 11,753,417 | 12,889,957 |
| |||||
Loan and other borrowings | $ | 3,447,325 | 15,779,820 | 28,441,348 |
| |||||
$ | 66,775,592 | 70,610,992 | 78,020,114 |
| ||||||
less: Current Liabilities contingent upon future gold sales | $ | (13,383,553 | ) | (16,608,385 | ) | (18,268,990 | ) | |||
Total Current Liabilities for Working Capital | $ | 53,392,039 | 54,061,105 | 59,751,124 |
|
Inventory
Gold inventory is recognised in the ore stockpiles and in production inventory, comprised principally of ore stockpile and doré at site or in transit to the refinery, with a component of gold-in-circuit.
Inventory
September 30 | June 30 | March 31 |
| |||||||
Plant spares and consumables | $ | 2,285,788 | 3,071,586 | 1,513,438 |
| |||||
Gold ore in stockpile | $ | 5,801,769 | 9,728,233 | 4,203,827 |
| |||||
Gold in circuit | $ | 1,774,547 | 2,457,696 | 2,581,292 |
| |||||
Gold dore 1 | $ | 1,718,947 | 8,788,510 | 8,236,386 |
| |||||
Total assets measured at amortised cost | $ | 11,581,051 | 24,046,025 | 16,534,943 |
|
1 Gold dore is valued at cost ($772/oz), which comprises production cost, depreciation and amortisation.
Liquidity and Capital Resources
The Company has generated strong operating cash flow during Q3 2022 and expects to continue to do so based on its production and AISC guidance. This strong operating cash flow will support debt repayments, regional exploration and underground expansion drilling at Segilola, planned capital expenditures and corporate overhead costs.
CONDENSED CONSOLIDATED FINANCIAL STATEMENTS
THOR EXPLORATIONS LTD. | |||||||
| |||||||
CONDENSED CONSOLIDATED STATEMENT OF FINANCIAL POSITION | |||||||
In United States dollars (unaudited) |
| ||||||
September 30, | December 31, | ||||||
Note | 2022 | 2021 |
| ||||
ASSETS | |||||||
Current assets | |||||||
Cash | 2,459,709 | 1,276,270 | |||||
Restricted cash | 6 | - | 3,495,992 | ||||
Inventory | 7 | 11,581,051 | 18,146,558 | ||||
Amounts receivable | 8 | 466,575 | 237,651 | ||||
Prepaid expenses, advances and deposits | 9 | 3,291,720 | 586,865 |
| |||
Total current assets | 17,799,055 | 23,743,336 | |||||
Non-current assets |
|
| |||||
Deferred income tax assets | 74,753 | 86,795 | |||||
Prepaid expenses, advances and deposits | 9 | 240,867 | 105,683 | ||||
Right-of-use assets | 10 | 17,143,126 | 20,843,612 | ||||
Property, plant and equipment | 15 | 144,289,041 | 147,373,656 | ||||
Intangible assets | 16 | 15,173,671 | 15,345,419 |
| |||
Total non-current assets | 176,921,458 | 183,755,165 |
| ||||
TOTAL ASSETS | 194,720,513 | 207,498,501 |
| ||||
|
| ||||||
LIABILITIES |
|
| |||||
Current liabilities |
|
| |||||
Accounts payable and accrued liabilities | 17 | 48,670,354 | 38,827,489 | ||||
Lease liabilities | 10 | 4,766,383 | 4,849,088 | ||||
Gold stream liability | 11 | 9,891,530 | 12,837,633 | ||||
Loans and other borrowings | 12 | 4,586,279 | 27,984,078 |
| |||
Total current liabilities | 67,914,546 | 84,498,288 | |||||
Non-current liabilities |
|
| |||||
Accounts payable and accrued liabilities | 17 | - | 1,564,191 | ||||
Lease liabilities | 10 | 11,528,190 | 13,425,286 | ||||
Gold stream liability | 11 | 16,774,634 | 17,424,646 | ||||
Loans and other borrowings | 12 | 26,129,889 | 25,754,525 | ||||
Provisions | 14 | 5,353,193 | 5,238,176 |
| |||
Total non-current liabilities | 59,785,906 | 63,406,824 | |||||
|
| ||||||
SHAREHOLDERS' EQUITY |
|
| |||||
Common shares | 18 | 79,949,297 | 79,027,183 | ||||
Option reserve | 18 | 3,455,454 | |||||
