
 Yahoo Movies
 We Think G3 Global Berhad (KLSE:G3) Can Afford To Drive Business Growth
There's no doubt that money can be made by owning shares of unprofitable businesses. For example, although software-as-a-service business Salesforce.com lost money for years while it grew recurring revenue, if you held shares since 2005, you'd have done very well indeed. But while the successes are well known, investors should not ignore the very many unprofitable companies that simply burn through all their cash and collapse.
Given this risk, we thought we'd take a look at whether G3 Global Berhad (KLSE:G3) shareholders should be worried about its cash burn. For the purposes of this article, cash burn is the annual rate at which an unprofitable company spends cash to fund its growth; its negative free cash flow. First, we'll determine its cash runway by comparing its cash burn with its cash reserves.
See our latest analysis for G3 Global Berhad
Does G3 Global Berhad Have A Long Cash Runway?
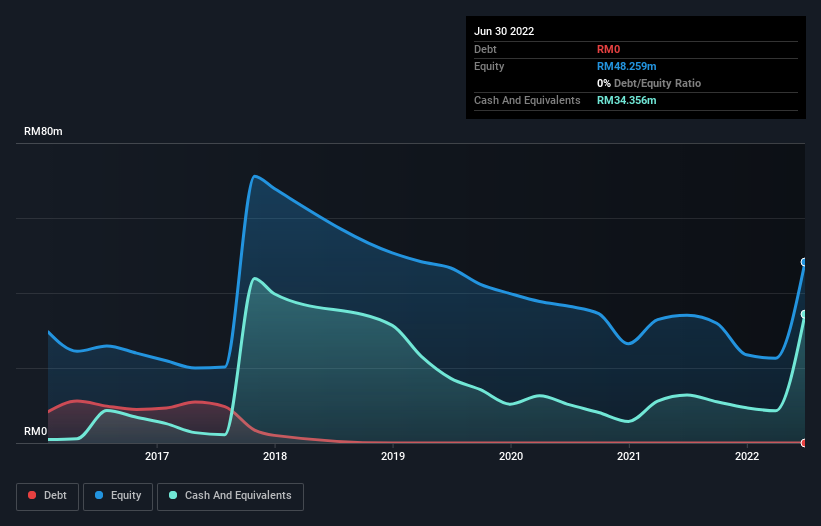
You can calculate a company's cash runway by dividing the amount of cash it has by the rate at which it is spending that cash. When G3 Global Berhad last reported its balance sheet in June 2022, it had zero debt and cash worth RM34m. Importantly, its cash burn was RM5.5m over the trailing twelve months. So it had a cash runway of about 6.3 years from June 2022. Even though this is but one measure of the company's cash burn, the thought of such a long cash runway warms our bellies in a comforting way. You can see how its cash balance has changed over time in the image below.
How Well Is G3 Global Berhad Growing?
Some investors might find it troubling that G3 Global Berhad is actually increasing its cash burn, which is up 25% in the last year. Given that it boosted operating revenue by a stand-out 361% in the same period, we think management are simply more focussed on growth than preserving cash. Sometimes you need to spend money to make money! It seems to be growing nicely. Of course, we've only taken a quick look at the stock's growth metrics, here. You can take a look at how G3 Global Berhad is growing revenue over time by checking this visualization of past revenue growth.
Can G3 Global Berhad Raise More Cash Easily?
There's no doubt G3 Global Berhad seems to be in a fairly good position, when it comes to managing its cash burn, but even if it's only hypothetical, it's always worth asking how easily it could raise more money to fund growth. Issuing new shares, or taking on debt, are the most common ways for a listed company to raise more money for its business. Many companies end up issuing new shares to fund future growth. By looking at a company's cash burn relative to its market capitalisation, we gain insight on how much shareholders would be diluted if the company needed to raise enough cash to cover another year's cash burn.
Since it has a market capitalisation of RM102m, G3 Global Berhad's RM5.5m in cash burn equates to about 5.4% of its market value. That's a low proportion, so we figure the company would be able to raise more cash to fund growth, with a little dilution, or even to simply borrow some money.
Is G3 Global Berhad's Cash Burn A Worry?
It may already be apparent to you that we're relatively comfortable with the way G3 Global Berhad is burning through its cash. In particular, we think its revenue growth stands out as evidence that the company is well on top of its spending. While its increasing cash burn wasn't great, the other factors mentioned in this article more than make up for weakness on that measure. Looking at all the measures in this article, together, we're not worried about its rate of cash burn; the company seems well on top of its medium-term spending needs. On another note, G3 Global Berhad has 4 warning signs (and 2 which are concerning) we think you should know about.
Of course, you might find a fantastic investment by looking elsewhere. So take a peek at this free list of companies insiders are buying, and this list of stocks growth stocks (according to analyst forecasts)
Have feedback on this article? Concerned about the content? Get in touch with us directly. Alternatively, email editorial-team (at) simplywallst.com.
This article by Simply Wall St is general in nature. We provide commentary based on historical data and analyst forecasts only using an unbiased methodology and our articles are not intended to be financial advice. It does not constitute a recommendation to buy or sell any stock, and does not take account of your objectives, or your financial situation. We aim to bring you long-term focused analysis driven by fundamental data. Note that our analysis may not factor in the latest price-sensitive company announcements or qualitative material. Simply Wall St has no position in any stocks mentioned.
Join A Paid User Research Session
You’ll receive a US$30 Amazon Gift card for 1 hour of your time while helping us build better investing tools for the individual investors like yourself. Sign up here

