
 Yahoo Movies
 Smartsheet's (NYSE:SMAR) growing losses don't faze investors as the stock climbs 3.1% this past week
The most you can lose on any stock (assuming you don't use leverage) is 100% of your money. But in contrast you can make much more than 100% if the company does well. For instance the Smartsheet Inc. (NYSE:SMAR) share price is 198% higher than it was three years ago. That sort of return is as solid as granite. It's even up 3.1% in the last week. But this could be related to the buoyant market which is up about 2.6% in a week.
Since it's been a strong week for Smartsheet shareholders, let's have a look at trend of the longer term fundamentals.
Check out our latest analysis for Smartsheet
Because Smartsheet made a loss in the last twelve months, we think the market is probably more focussed on revenue and revenue growth, at least for now. When a company doesn't make profits, we'd generally expect to see good revenue growth. That's because it's hard to be confident a company will be sustainable if revenue growth is negligible, and it never makes a profit.
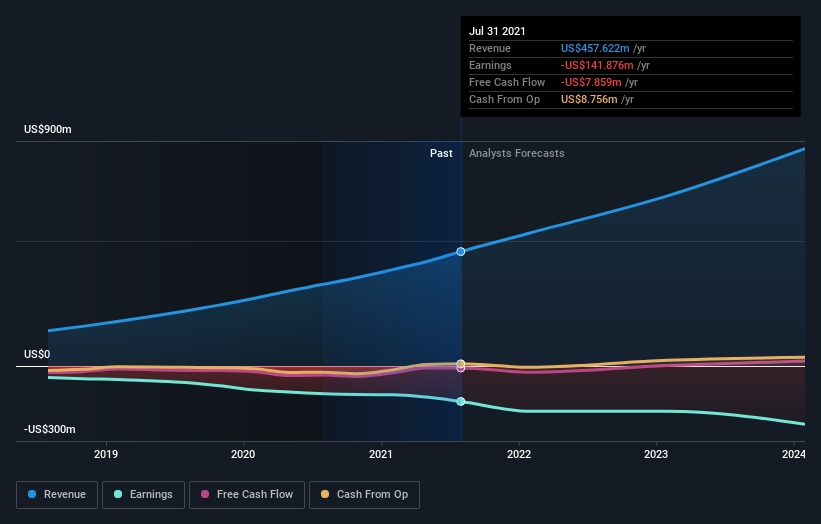
In the last 3 years Smartsheet saw its revenue grow at 37% per year. That's much better than most loss-making companies. Meanwhile, the share price performance has been pretty solid at 44% compound over three years. But it does seem like the market is paying attention to strong revenue growth. That's not to say we think the share price is too high. In fact, it might be worth keeping an eye on this one.
The company's revenue and earnings (over time) are depicted in the image below (click to see the exact numbers).
We like that insiders have been buying shares in the last twelve months. Even so, future earnings will be far more important to whether current shareholders make money. If you are thinking of buying or selling Smartsheet stock, you should check out this free report showing analyst profit forecasts.
A Different Perspective
Over the last year Smartsheet shareholders have received a TSR of 28%. While you don't go broke making a profit, this return was actually lower than the average market return of about 33%. But the (superior) three-year TSR of 44% per year is some consolation. Even the best companies don't see strong share price performance every year. I find it very interesting to look at share price over the long term as a proxy for business performance. But to truly gain insight, we need to consider other information, too. Even so, be aware that Smartsheet is showing 4 warning signs in our investment analysis , and 1 of those doesn't sit too well with us...
If you like to buy stocks alongside management, then you might just love this free list of companies. (Hint: insiders have been buying them).
Please note, the market returns quoted in this article reflect the market weighted average returns of stocks that currently trade on US exchanges.
This article by Simply Wall St is general in nature. We provide commentary based on historical data and analyst forecasts only using an unbiased methodology and our articles are not intended to be financial advice. It does not constitute a recommendation to buy or sell any stock, and does not take account of your objectives, or your financial situation. We aim to bring you long-term focused analysis driven by fundamental data. Note that our analysis may not factor in the latest price-sensitive company announcements or qualitative material. Simply Wall St has no position in any stocks mentioned.
Have feedback on this article? Concerned about the content? Get in touch with us directly. Alternatively, email editorial-team (at) simplywallst.com.
