
 Yahoo Movies
 Is SIG Group AG's (VTX:SIGN) Stock Price Struggling As A Result Of Its Mixed Financials?
It is hard to get excited after looking at SIG Group's (VTX:SIGN) recent performance, when its stock has declined 9.1% over the past three months. It is possible that the markets have ignored the company's differing financials and decided to lean-in to the negative sentiment. Fundamentals usually dictate market outcomes so it makes sense to study the company's financials. Particularly, we will be paying attention to SIG Group's ROE today.
Return on equity or ROE is a key measure used to assess how efficiently a company's management is utilizing the company's capital. In other words, it is a profitability ratio which measures the rate of return on the capital provided by the company's shareholders.
See our latest analysis for SIG Group
How To Calculate Return On Equity?
Return on equity can be calculated by using the formula:
Return on Equity = Net Profit (from continuing operations) ÷ Shareholders' Equity
So, based on the above formula, the ROE for SIG Group is:
4.6% = €147m ÷ €3.2b (Based on the trailing twelve months to June 2022).
The 'return' is the income the business earned over the last year. So, this means that for every CHF1 of its shareholder's investments, the company generates a profit of CHF0.05.
Why Is ROE Important For Earnings Growth?
So far, we've learned that ROE is a measure of a company's profitability. We now need to evaluate how much profit the company reinvests or "retains" for future growth which then gives us an idea about the growth potential of the company. Generally speaking, other things being equal, firms with a high return on equity and profit retention, have a higher growth rate than firms that don’t share these attributes.
A Side By Side comparison of SIG Group's Earnings Growth And 4.6% ROE
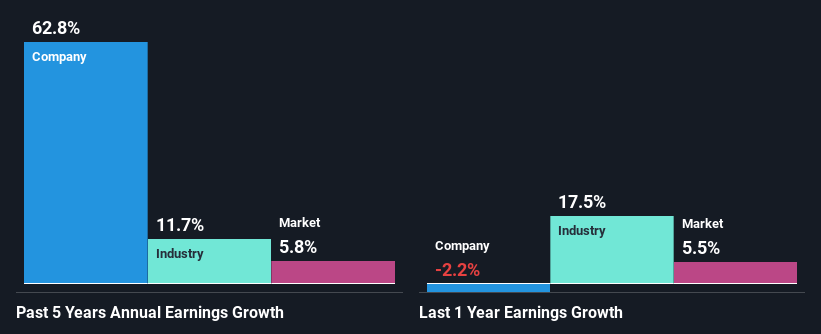
At first glance, SIG Group's ROE doesn't look very promising. We then compared the company's ROE to the broader industry and were disappointed to see that the ROE is lower than the industry average of 13%. However, we we're pleasantly surprised to see that SIG Group grew its net income at a significant rate of 63% in the last five years. Therefore, there could be other reasons behind this growth. For instance, the company has a low payout ratio or is being managed efficiently.
As a next step, we compared SIG Group's net income growth with the industry, and pleasingly, we found that the growth seen by the company is higher than the average industry growth of 12%.
Earnings growth is a huge factor in stock valuation. What investors need to determine next is if the expected earnings growth, or the lack of it, is already built into the share price. This then helps them determine if the stock is placed for a bright or bleak future. Has the market priced in the future outlook for SIGN? You can find out in our latest intrinsic value infographic research report.
Is SIG Group Efficiently Re-investing Its Profits?
The really high three-year median payout ratio of 101% for SIG Group suggests that the company is paying its shareholders more than what it is earning. In spite of this, the company was able to grow its earnings significantly, as we saw above. Although, it could be worth keeping an eye on the high payout ratio as that's a huge risk. To know the 3 risks we have identified for SIG Group visit our risks dashboard for free.
Additionally, SIG Group has paid dividends over a period of four years which means that the company is pretty serious about sharing its profits with shareholders. Our latest analyst data shows that the future payout ratio of the company is expected to drop to 57% over the next three years. Accordingly, the expected drop in the payout ratio explains the expected increase in the company's ROE to 18%, over the same period.
Summary
In total, we're a bit ambivalent about SIG Group's performance. While no doubt its earnings growth is pretty substantial, its ROE and earnings retention is quite poor. So while the company has managed to grow its earnings in spite of this, we are unconvinced if this growth could extend, especially during troubled times. With that said, the latest industry analyst forecasts reveal that the company's earnings growth is expected to slow down. To know more about the company's future earnings growth forecasts take a look at this free report on analyst forecasts for the company to find out more.
Have feedback on this article? Concerned about the content? Get in touch with us directly. Alternatively, email editorial-team (at) simplywallst.com.
This article by Simply Wall St is general in nature. We provide commentary based on historical data and analyst forecasts only using an unbiased methodology and our articles are not intended to be financial advice. It does not constitute a recommendation to buy or sell any stock, and does not take account of your objectives, or your financial situation. We aim to bring you long-term focused analysis driven by fundamental data. Note that our analysis may not factor in the latest price-sensitive company announcements or qualitative material. Simply Wall St has no position in any stocks mentioned.
Join A Paid User Research Session
You’ll receive a US$30 Amazon Gift card for 1 hour of your time while helping us build better investing tools for the individual investors like yourself. Sign up here

