
 Yahoo Movies
 Is Saga plc (LON:SAGA) Popular Amongst Insiders?
A look at the shareholders of Saga plc (LON:SAGA) can tell us which group is most powerful. Generally speaking, as a company grows, institutions will increase their ownership. Conversely, insiders often decrease their ownership over time. I generally like to see some degree of insider ownership, even if only a little. As Nassim Nicholas Taleb said, 'Don’t tell me what you think, tell me what you have in your portfolio.
With a market capitalization of UK£250m, Saga is a small cap stock, so it might not be well known by many institutional investors. Taking a look at our data on the ownership groups (below), it seems that institutional investors have bought into the company. Let's take a closer look to see what the different types of shareholders can tell us about Saga.
See our latest analysis for Saga
What Does The Institutional Ownership Tell Us About Saga?
Many institutions measure their performance against an index that approximates the local market. So they usually pay more attention to companies that are included in major indices.
Saga already has institutions on the share registry. Indeed, they own a respectable stake in the company. This implies the analysts working for those institutions have looked at the stock and they like it. But just like anyone else, they could be wrong. When multiple institutions own a stock, there's always a risk that they are in a 'crowded trade'. When such a trade goes wrong, multiple parties may compete to sell stock fast. This risk is higher in a company without a history of growth. You can see Saga's historic earnings and revenue below, but keep in mind there's always more to the story.

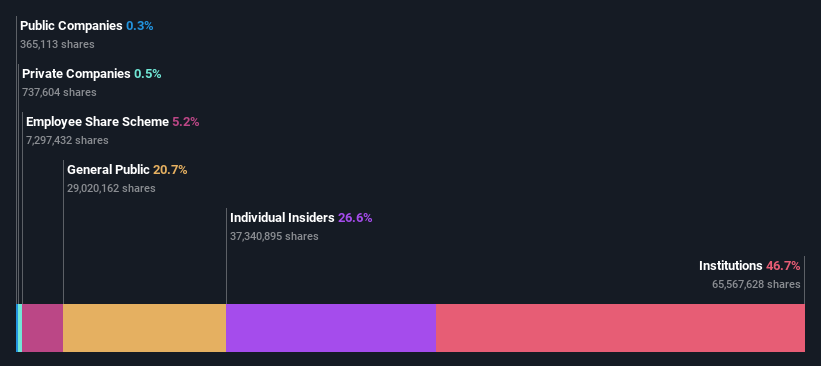
We note that hedge funds don't have a meaningful investment in Saga. The company's largest shareholder is Roger De Haan, with ownership of 27%. Saga Plc., Employee Stock Ownership Plan is the second largest shareholder owning 5.2% of common stock, and UBS Asset Management holds about 3.9% of the company stock.
We also observed that the top 9 shareholders account for more than half of the share register, with a few smaller shareholders to balance the interests of the larger ones to a certain extent.
While it makes sense to study institutional ownership data for a company, it also makes sense to study analyst sentiments to know which way the wind is blowing. There is some analyst coverage of the stock, but it could still become more well known, with time.
Insider Ownership Of Saga
While the precise definition of an insider can be subjective, almost everyone considers board members to be insiders. The company management answer to the board and the latter should represent the interests of shareholders. Notably, sometimes top-level managers are on the board themselves.
Most consider insider ownership a positive because it can indicate the board is well aligned with other shareholders. However, on some occasions too much power is concentrated within this group.
It seems insiders own a significant proportion of Saga plc. It has a market capitalization of just UK£250m, and insiders have UK£66m worth of shares in their own names. It is great to see insiders so invested in the business. It might be worth checking if those insiders have been buying recently.
General Public Ownership
The general public-- including retail investors -- own 21% stake in the company, and hence can't easily be ignored. This size of ownership, while considerable, may not be enough to change company policy if the decision is not in sync with other large shareholders.
Next Steps:
I find it very interesting to look at who exactly owns a company. But to truly gain insight, we need to consider other information, too.
I always like to check for a history of revenue growth. You can too, by accessing this free chart of historic revenue and earnings in this detailed graph.
If you are like me, you may want to think about whether this company will grow or shrink. Luckily, you can check this free report showing analyst forecasts for its future.
NB: Figures in this article are calculated using data from the last twelve months, which refer to the 12-month period ending on the last date of the month the financial statement is dated. This may not be consistent with full year annual report figures.
Have feedback on this article? Concerned about the content? Get in touch with us directly. Alternatively, email editorial-team (at) simplywallst.com.
This article by Simply Wall St is general in nature. We provide commentary based on historical data and analyst forecasts only using an unbiased methodology and our articles are not intended to be financial advice. It does not constitute a recommendation to buy or sell any stock, and does not take account of your objectives, or your financial situation. We aim to bring you long-term focused analysis driven by fundamental data. Note that our analysis may not factor in the latest price-sensitive company announcements or qualitative material. Simply Wall St has no position in any stocks mentioned.
Join A Paid User Research Session
You’ll receive a US$30 Amazon Gift card for 1 hour of your time while helping us build better investing tools for the individual investors like yourself. Sign up here

