
 Yahoo Movies
 What You Need To Know About QUALCOMM Incorporated's (NASDAQ:QCOM) Investor Composition
A look at the shareholders of QUALCOMM Incorporated (NASDAQ:QCOM) can tell us which group is most powerful. Generally speaking, as a company grows, institutions will increase their ownership. Conversely, insiders often decrease their ownership over time. Companies that have been privatized tend to have low insider ownership.
QUALCOMM is a pretty big company. It has a market capitalization of US$147b. Normally institutions would own a significant portion of a company this size. Taking a look at our data on the ownership groups (below), it seems that institutions are noticeable on the share registry. Let's delve deeper into each type of owner, to discover more about QUALCOMM.
See our latest analysis for QUALCOMM
What Does The Institutional Ownership Tell Us About QUALCOMM?
Many institutions measure their performance against an index that approximates the local market. So they usually pay more attention to companies that are included in major indices.
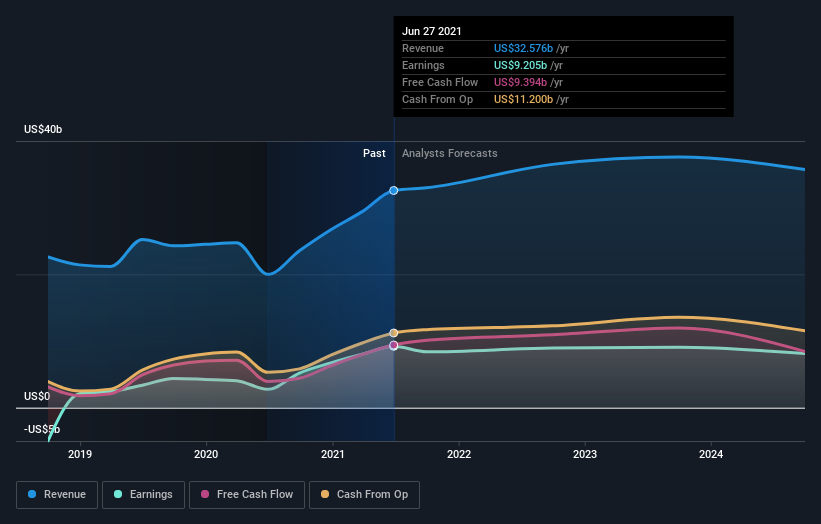
As you can see, institutional investors have a fair amount of stake in QUALCOMM. This implies the analysts working for those institutions have looked at the stock and they like it. But just like anyone else, they could be wrong. It is not uncommon to see a big share price drop if two large institutional investors try to sell out of a stock at the same time. So it is worth checking the past earnings trajectory of QUALCOMM, (below). Of course, keep in mind that there are other factors to consider, too.
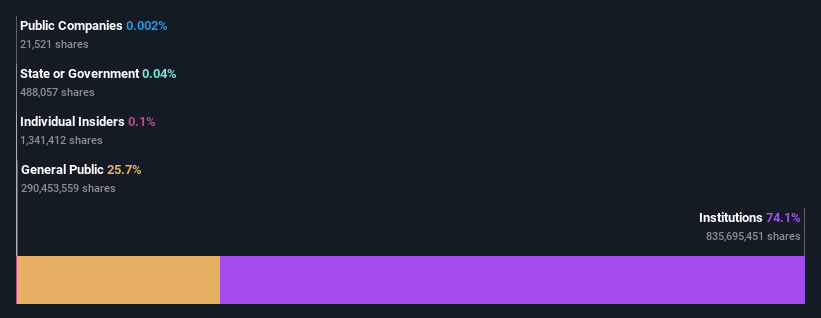
Institutional investors own over 50% of the company, so together than can probably strongly influence board decisions. QUALCOMM is not owned by hedge funds. The Vanguard Group, Inc. is currently the largest shareholder, with 9.1% of shares outstanding. With 7.1% and 4.2% of the shares outstanding respectively, BlackRock, Inc. and State Street Global Advisors, Inc. are the second and third largest shareholders.
Our studies suggest that the top 25 shareholders collectively control less than half of the company's shares, meaning that the company's shares are widely disseminated and there is no dominant shareholder.
While it makes sense to study institutional ownership data for a company, it also makes sense to study analyst sentiments to know which way the wind is blowing. There are a reasonable number of analysts covering the stock, so it might be useful to find out their aggregate view on the future.
Insider Ownership Of QUALCOMM
The definition of company insiders can be subjective and does vary between jurisdictions. Our data reflects individual insiders, capturing board members at the very least. Company management run the business, but the CEO will answer to the board, even if he or she is a member of it.
Insider ownership is positive when it signals leadership are thinking like the true owners of the company. However, high insider ownership can also give immense power to a small group within the company. This can be negative in some circumstances.
Our information suggests that QUALCOMM Incorporated insiders own under 1% of the company. Being so large, we would not expect insiders to own a large proportion of the stock. Collectively, they own US$175m of stock. Arguably recent buying and selling is just as important to consider. You can click here to see if insiders have been buying or selling.
General Public Ownership
With a 26% ownership, the general public have some degree of sway over QUALCOMM. While this group can't necessarily call the shots, it can certainly have a real influence on how the company is run.
Next Steps:
While it is well worth considering the different groups that own a company, there are other factors that are even more important. Take risks for example - QUALCOMM has 1 warning sign we think you should be aware of.
If you are like me, you may want to think about whether this company will grow or shrink. Luckily, you can check this free report showing analyst forecasts for its future.
NB: Figures in this article are calculated using data from the last twelve months, which refer to the 12-month period ending on the last date of the month the financial statement is dated. This may not be consistent with full year annual report figures.
Simply Wall St analyst Simply Wall St and Simply Wall St have no position in any of the companies mentioned. This article is general in nature. We provide commentary based on historical data and analyst forecasts only using an unbiased methodology and our articles are not intended to be financial advice. It does not constitute a recommendation to buy or sell any stock and does not take account of your objectives, or your financial situation. We aim to bring you long-term focused analysis driven by fundamental data. Note that our analysis may not factor in the latest price-sensitive company announcements or qualitative material.
Have feedback on this article? Concerned about the content? Get in touch with us directly. Alternatively, email editorial-team@simplywallst.com

