
 Yahoo Movies
 Is Perimeter Medical Imaging AI (CVE:PINK) In A Good Position To Deliver On Growth Plans?
We can readily understand why investors are attracted to unprofitable companies. For example, although Amazon.com made losses for many years after listing, if you had bought and held the shares since 1999, you would have made a fortune. But while history lauds those rare successes, those that fail are often forgotten; who remembers Pets.com?
So should Perimeter Medical Imaging AI (CVE:PINK) shareholders be worried about its cash burn? For the purposes of this article, cash burn is the annual rate at which an unprofitable company spends cash to fund its growth; its negative free cash flow. First, we'll determine its cash runway by comparing its cash burn with its cash reserves.
See our latest analysis for Perimeter Medical Imaging AI
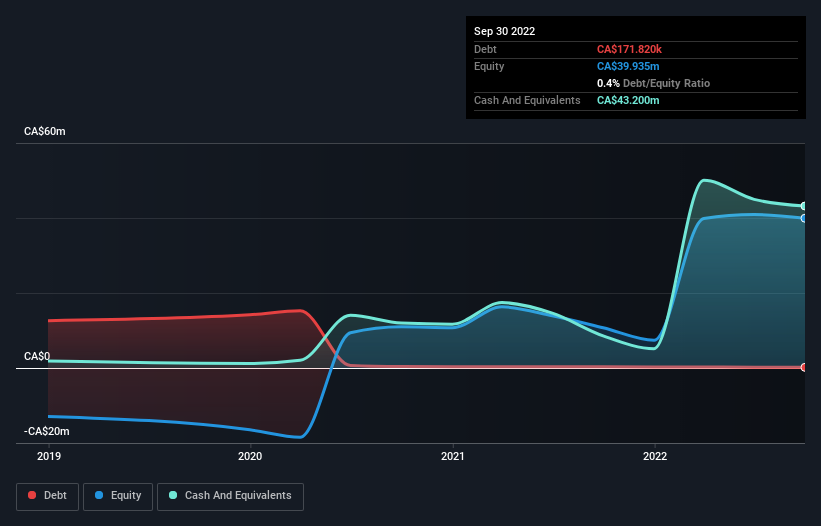
How Long Is Perimeter Medical Imaging AI's Cash Runway?
A company's cash runway is the amount of time it would take to burn through its cash reserves at its current cash burn rate. Perimeter Medical Imaging AI has such a small amount of debt that we'll set it aside, and focus on the CA$43m in cash it held at September 2022. In the last year, its cash burn was CA$20m. That means it had a cash runway of about 2.2 years as of September 2022. Arguably, that's a prudent and sensible length of runway to have. The image below shows how its cash balance has been changing over the last few years.
How Is Perimeter Medical Imaging AI's Cash Burn Changing Over Time?
Although Perimeter Medical Imaging AI had revenue of CA$474k in the last twelve months, its operating revenue was only CA$87k in that time period. We don't think that's enough operating revenue for us to understand too much from revenue growth rates, since the company is growing off a low base. So we'll focus on the cash burn, today. Over the last year its cash burn actually increased by 32%, which suggests that management are increasing investment in future growth, but not too quickly. However, the company's true cash runway will therefore be shorter than suggested above, if spending continues to increase. Clearly, however, the crucial factor is whether the company will grow its business going forward. So you might want to take a peek at how much the company is expected to grow in the next few years.
Can Perimeter Medical Imaging AI Raise More Cash Easily?
While Perimeter Medical Imaging AI does have a solid cash runway, its cash burn trajectory may have some shareholders thinking ahead to when the company may need to raise more cash. Companies can raise capital through either debt or equity. One of the main advantages held by publicly listed companies is that they can sell shares to investors to raise cash and fund growth. By comparing a company's annual cash burn to its total market capitalisation, we can estimate roughly how many shares it would have to issue in order to run the company for another year (at the same burn rate).
Since it has a market capitalisation of CA$77m, Perimeter Medical Imaging AI's CA$20m in cash burn equates to about 25% of its market value. That's not insignificant, and if the company had to sell enough shares to fund another year's growth at the current share price, you'd likely witness fairly costly dilution.
How Risky Is Perimeter Medical Imaging AI's Cash Burn Situation?
On this analysis of Perimeter Medical Imaging AI's cash burn, we think its cash runway was reassuring, while its increasing cash burn has us a bit worried. Cash burning companies are always on the riskier side of things, but after considering all of the factors discussed in this short piece, we're not too worried about its rate of cash burn. Taking a deeper dive, we've spotted 4 warning signs for Perimeter Medical Imaging AI you should be aware of, and 1 of them is potentially serious.
Of course Perimeter Medical Imaging AI may not be the best stock to buy. So you may wish to see this free collection of companies boasting high return on equity, or this list of stocks that insiders are buying.
Have feedback on this article? Concerned about the content? Get in touch with us directly. Alternatively, email editorial-team (at) simplywallst.com.
This article by Simply Wall St is general in nature. We provide commentary based on historical data and analyst forecasts only using an unbiased methodology and our articles are not intended to be financial advice. It does not constitute a recommendation to buy or sell any stock, and does not take account of your objectives, or your financial situation. We aim to bring you long-term focused analysis driven by fundamental data. Note that our analysis may not factor in the latest price-sensitive company announcements or qualitative material. Simply Wall St has no position in any stocks mentioned.
Join A Paid User Research Session
You’ll receive a US$30 Amazon Gift card for 1 hour of your time while helping us build better investing tools for the individual investors like yourself. Sign up here

