
 Yahoo Movies
 Is PBT Group Limited's (JSE:PBG) Latest Stock Performance A Reflection Of Its Financial Health?
Most readers would already be aware that PBT Group's (JSE:PBG) stock increased significantly by 11% over the past month. Given that the market rewards strong financials in the long-term, we wonder if that is the case in this instance. In this article, we decided to focus on PBT Group's ROE.
Return on Equity or ROE is a test of how effectively a company is growing its value and managing investors’ money. In other words, it is a profitability ratio which measures the rate of return on the capital provided by the company's shareholders.
Check out our latest analysis for PBT Group
How To Calculate Return On Equity?
The formula for return on equity is:
Return on Equity = Net Profit (from continuing operations) ÷ Shareholders' Equity
So, based on the above formula, the ROE for PBT Group is:
25% = R92m ÷ R366m (Based on the trailing twelve months to March 2022).
The 'return' is the yearly profit. That means that for every ZAR1 worth of shareholders' equity, the company generated ZAR0.25 in profit.
Why Is ROE Important For Earnings Growth?
We have already established that ROE serves as an efficient profit-generating gauge for a company's future earnings. We now need to evaluate how much profit the company reinvests or "retains" for future growth which then gives us an idea about the growth potential of the company. Generally speaking, other things being equal, firms with a high return on equity and profit retention, have a higher growth rate than firms that don’t share these attributes.
PBT Group's Earnings Growth And 25% ROE
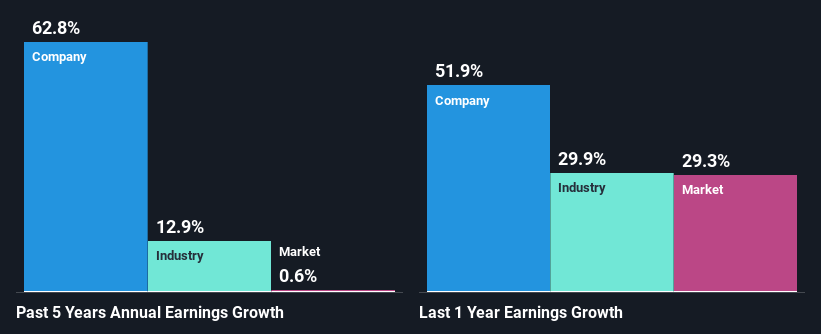
To begin with, PBT Group seems to have a respectable ROE. Further, the company's ROE compares quite favorably to the industry average of 11%. Probably as a result of this, PBT Group was able to see an impressive net income growth of 63% over the last five years. However, there could also be other causes behind this growth. For instance, the company has a low payout ratio or is being managed efficiently.
We then compared PBT Group's net income growth with the industry and we're pleased to see that the company's growth figure is higher when compared with the industry which has a growth rate of 13% in the same period.
Earnings growth is an important metric to consider when valuing a stock. The investor should try to establish if the expected growth or decline in earnings, whichever the case may be, is priced in. By doing so, they will have an idea if the stock is headed into clear blue waters or if swampy waters await. One good indicator of expected earnings growth is the P/E ratio which determines the price the market is willing to pay for a stock based on its earnings prospects. So, you may want to check if PBT Group is trading on a high P/E or a low P/E, relative to its industry.
Is PBT Group Efficiently Re-investing Its Profits?
The three-year median payout ratio for PBT Group is 40%, which is moderately low. The company is retaining the remaining 60%. So it seems that PBT Group is reinvesting efficiently in a way that it sees impressive growth in its earnings (discussed above) and pays a dividend that's well covered.
Moreover, PBT Group is determined to keep sharing its profits with shareholders which we infer from its long history of nine years of paying a dividend.
Conclusion
In total, we are pretty happy with PBT Group's performance. Specifically, we like that the company is reinvesting a huge chunk of its profits at a high rate of return. This of course has caused the company to see substantial growth in its earnings. If the company continues to grow its earnings the way it has, that could have a positive impact on its share price given how earnings per share influence long-term share prices. Remember, the price of a stock is also dependent on the perceived risk. Therefore investors must keep themselves informed about the risks involved before investing in any company. Our risks dashboard would have the 2 risks we have identified for PBT Group.
Have feedback on this article? Concerned about the content? Get in touch with us directly. Alternatively, email editorial-team (at) simplywallst.com.
This article by Simply Wall St is general in nature. We provide commentary based on historical data and analyst forecasts only using an unbiased methodology and our articles are not intended to be financial advice. It does not constitute a recommendation to buy or sell any stock, and does not take account of your objectives, or your financial situation. We aim to bring you long-term focused analysis driven by fundamental data. Note that our analysis may not factor in the latest price-sensitive company announcements or qualitative material. Simply Wall St has no position in any stocks mentioned.
Join A Paid User Research Session
You’ll receive a US$30 Amazon Gift card for 1 hour of your time while helping us build better investing tools for the individual investors like yourself. Sign up here

