
 Yahoo Movies
 Is PayPoint plc's (LON:PAY) Recent Stock Performance Influenced By Its Financials In Any Way?
PayPoint's (LON:PAY) stock up by 1.9% over the past three months. Given that stock prices are usually aligned with a company's financial performance in the long-term, we decided to investigate if the company's decent financials had a hand to play in the recent price move. Particularly, we will be paying attention to PayPoint's ROE today.
Return on Equity or ROE is a test of how effectively a company is growing its value and managing investors’ money. In simpler terms, it measures the profitability of a company in relation to shareholder's equity.
Check out our latest analysis for PayPoint
How To Calculate Return On Equity?
ROE can be calculated by using the formula:
Return on Equity = Net Profit (from continuing operations) ÷ Shareholders' Equity
So, based on the above formula, the ROE for PayPoint is:
47% = UK£40m ÷ UK£83m (Based on the trailing twelve months to March 2022).
The 'return' is the amount earned after tax over the last twelve months. So, this means that for every £1 of its shareholder's investments, the company generates a profit of £0.47.
What Has ROE Got To Do With Earnings Growth?
We have already established that ROE serves as an efficient profit-generating gauge for a company's future earnings. Depending on how much of these profits the company reinvests or "retains", and how effectively it does so, we are then able to assess a company’s earnings growth potential. Assuming all else is equal, companies that have both a higher return on equity and higher profit retention are usually the ones that have a higher growth rate when compared to companies that don't have the same features.
A Side By Side comparison of PayPoint's Earnings Growth And 47% ROE
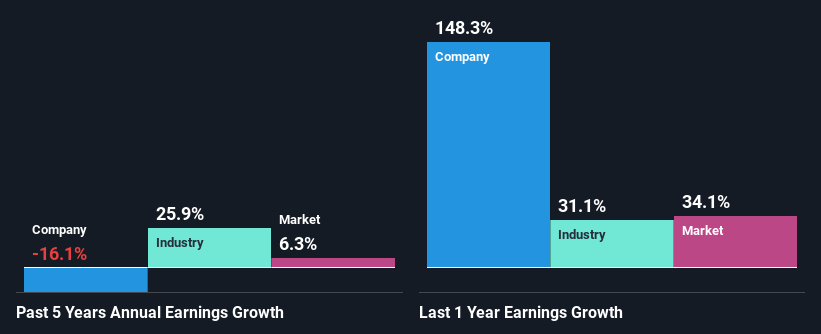
Firstly, we acknowledge that PayPoint has a significantly high ROE. Additionally, the company's ROE is higher compared to the industry average of 8.0% which is quite remarkable. Needless to say, we are quite surprised to see that PayPoint's net income shrunk at a rate of 16% over the past five years. We reckon that there could be some other factors at play here that are preventing the company's growth. For example, it could be that the company has a high payout ratio or the business has allocated capital poorly, for instance.
That being said, we compared PayPoint's performance with the industry and were concerned when we found that while the company has shrunk its earnings, the industry has grown its earnings at a rate of 26% in the same period.
The basis for attaching value to a company is, to a great extent, tied to its earnings growth. What investors need to determine next is if the expected earnings growth, or the lack of it, is already built into the share price. By doing so, they will have an idea if the stock is headed into clear blue waters or if swampy waters await. Is PayPoint fairly valued compared to other companies? These 3 valuation measures might help you decide.
Is PayPoint Making Efficient Use Of Its Profits?
PayPoint's declining earnings is not surprising given how the company is spending most of its profits in paying dividends, judging by its three-year median payout ratio of 71% (or a retention ratio of 29%). With only a little being reinvested into the business, earnings growth would obviously be low or non-existent. To know the 4 risks we have identified for PayPoint visit our risks dashboard for free.
In addition, PayPoint has been paying dividends over a period of at least ten years suggesting that keeping up dividend payments is way more important to the management even if it comes at the cost of business growth. Based on the latest analysts' estimates, we found that the company's future payout ratio over the next three years is expected to hold steady at 82%.
Conclusion
In total, it does look like PayPoint has some positive aspects to its business. However, while the company does have a high ROE, its earnings growth number is quite disappointing. This can be blamed on the fact that it reinvests only a small portion of its profits and pays out the rest as dividends. So far, we've only made a quick discussion around the company's earnings growth. You can do your own research on PayPoint and see how it has performed in the past by looking at this FREE detailed graph of past earnings, revenue and cash flows.
Have feedback on this article? Concerned about the content? Get in touch with us directly. Alternatively, email editorial-team (at) simplywallst.com.
This article by Simply Wall St is general in nature. We provide commentary based on historical data and analyst forecasts only using an unbiased methodology and our articles are not intended to be financial advice. It does not constitute a recommendation to buy or sell any stock, and does not take account of your objectives, or your financial situation. We aim to bring you long-term focused analysis driven by fundamental data. Note that our analysis may not factor in the latest price-sensitive company announcements or qualitative material. Simply Wall St has no position in any stocks mentioned.
Join A Paid User Research Session
You’ll receive a US$30 Amazon Gift card for 1 hour of your time while helping us build better investing tools for the individual investors like yourself. Sign up here
