Northeastern States: Which Economies Are Failing & Which Are Thriving?

More than 17% of the U.S. population lives in the Northeast, according to Statista. Known for cold winters, big cities and expensive living, the Northeast is a nine-state region that the U.S. Census Bureau breaks up into two divisions. New England includes Connecticut, Maine, Massachusetts, New Hampshire, Rhode Island and Vermont, and the Middle Atlantic consists of New Jersey, New York and Pennsylvania.
Find Out: 10 Things You Should Always Buy at Sam's Club
More: 3 Easy Tips To Turn Your Credit Woes Into Wows
They're among the oldest states in the country -- all but Maine and Vermont were among the original 13 colonies -- and they share many cultural and historical commonalities.
Even so, their economies are not all in the same shape.
Using data from sources such as the Bureau of Labor Statistics, the U.S. Census Bureau and the Bureau of Economic Analysis, GOBankingRates identified which states in the Northeast have economies that are doing well and which ones do not. The study considered factors like each state's unemployment rate, per capita GDP, wages and the percentage of the population living below the poverty line.
Keep reading to learn which Northeastern economies are failing and which ones are thriving.

Northeastern States Whose Economies Are Failing
Only two states in the Northeast have economies that are not performing well. If you live in either of them, you've probably noticed more people out of work, stagnant wages and other signs of distress.

Pennsylvania
March 2022 unemployment rate: 4.9%
Year-over-year change in unemployment March 2022: 3.4%
Q4 2021 GDP per capita: $67,485
GDP growth Q3-Q4 2021: 6.4%
Average weekly wages Q3 2021: $1,205
Percent change in average weekly wages Q3 2020-Q3 2021: 5.8%
Percent of population below poverty line 2019-20: 9.7%
Take Our Poll: Do You Think Student Loan Debt Should Be Forgiven?

Rhode Island
March 2022 unemployment rate: 3.4%
Year-over-year change in unemployment March 2022: 3.6%
Q4 2021 GDP per capita: $62,817
GDP growth Q3-Q4 2021: 5.3%
Average weekly wages Q3 2021: $1,131
Percent change in average weekly wages Q3 2020-Q3 2021: 3.6%
Percent of population below poverty line 2019-20: 8.8%

Northeastern States Whose Economies Are Thriving
Most of the Northeast is doing quite well. If you're considering moving to the region, these seven states are putting up strong employment numbers and showing big gains in economic production.
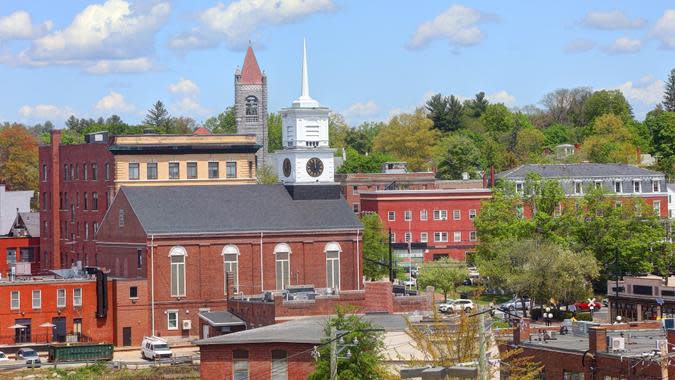
New Hampshire
March 2022 unemployment rate: 2.5%
Year-over-year change in unemployment March 2022: 3.8%
Q4 2021 GDP per capita: $73,751
GDP growth Q3-Q4 2021: 7.9%
Average weekly wages Q3 2021: $1,349
Percent change in average weekly wages Q3 2020-Q3 2021: 15%
Percent of population below poverty line 2019-20: 4.9%

Massachusetts
March 2022 unemployment rate: 4.3%
Year-over-year change in unemployment March 2022: 5.4%
Q4 2021 GDP per capita: $95,029
GDP growth Q3-Q4 2021: 7.8%
Average weekly wages Q3 2021: $1,593
Percent change in average weekly wages Q3 2020-Q3 2021: 7%
Percent of population below poverty line 2019-20: 8%

New Jersey
March 2022 unemployment rate: 4.2%
Year-over-year change in unemployment March 2022: 5.5%
Q4 2021 GDP per capita: $75,549
GDP growth Q3-Q4 2021: 7.4%
Average weekly wages Q3 2021: $1,384
Percent change in average weekly wages Q3 2020-Q3 2021: 4.1%
Percent of population below poverty line 2019-20: 7.2%
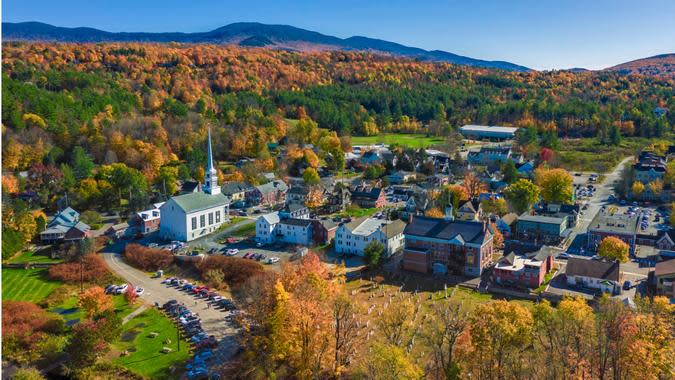
Vermont
March 2022 unemployment rate: 2.7%
Year-over-year change in unemployment March 2022: 3.5%
Q4 2021 GDP per capita: $58,311
GDP growth Q3-Q4 2021: 8%
Average weekly wages Q3 2021: $1,055
Percent change in average weekly wages Q3 2020-Q3 2021: 5.8%
Percent of population below poverty line 2019-20: 8.6%

New York
March 2022 unemployment rate: 4.6%
Year-over-year change in unemployment March 2022: 5.1%
Q4 2021 GDP per capita: $96,502
GDP growth Q3-Q4 2021: 4.8%
Average weekly wages Q3 2021: $1,534
Percent change in average weekly wages Q3 2020-Q3 2021: 6.1%
Percent of population below poverty line 2019-20: 12.1%

Connecticut
March 2022 unemployment rate: 4.6%
Year-over-year change in unemployment March 2022: 3%
Q4 2021 GDP per capita: $85,609
GDP growth Q3-Q4 2021: 7.7%
Average weekly wages Q3 2021: $1,401
Percent change in average weekly wages Q3 2020-Q3 2021: 5.7%
Percent of population below poverty line 2019-20: 9.8%

Maine
March 2022 unemployment rate: 3.6%
Year-over-year change in unemployment March 2022: 3.1%
Q4 2021 GDP per capita: $57,699
GDP growth Q3-Q4 2021: 6.8%
Average weekly wages Q3 2021: $1,031
Percent change in average weekly wages Q3 2020-Q3 2021: 6.7%
Percent of population below poverty line 2019-20: 9.2%
Methodology: GOBankingRates analyzed the following factors for each state and Washington D.C. to gauge the health of their economies: (1) March 2022 unemployment rates according to Burea of Labor Statistics (BLS) Local Area Unemployment Statistics; (2) the March 2022 year-over-year change in nonfarm payroll jobs, per the BLS State and Metro Area Employment, Hours, & Earnings data; (3) the Q4 2021 GDP per capita in current dollars, calculated by using population data from the Census Bureau's American Community Survey (ACS) 2020 5-year estimates and the Bureau of Economic Analysis's (BEA) most recent GDP by State release; (4) the percent by which GDP grew between Q3 and Q4 2021, also per the BEA GDP release; (5) the average weekly wage in Q3 2021, per the BLS Economic News Release; (6) percent change in the average weekly wage, September 2020 to September 2021, per the BLS Economic News Release; and (7) percent of the population living below the poverty line, according to the Census Bureau's Income and Poverty in the United States: 2020. States were scored on all factors and ranked against each other based on their combined total score. The states with the lowest combined scores were identified as states with thriving economies and the states with the highest combined scores were identified as states with failing economies. All data was collected on and up to date as of May 3, 2022.
More From GOBankingRates
This article originally appeared on GOBankingRates.com: Northeastern States: Which Economies Are Failing & Which Are Thriving?

 Yahoo Movies
