
 Yahoo Movies
 A Sliding Share Price Has Us Looking At Kaman Corporation's (NYSE:KAMN) P/E Ratio

To the annoyance of some shareholders, Kaman (NYSE:KAMN) shares are down a considerable 41% in the last month. Indeed the recent decline has arguably caused some bitterness for shareholders who have held through the 35% drop over twelve months.
All else being equal, a share price drop should make a stock more attractive to potential investors. In the long term, share prices tend to follow earnings per share, but in the short term prices bounce around in response to short term factors (which are not always obvious). So, on certain occasions, long term focussed investors try to take advantage of pessimistic expectations to buy shares at a better price. One way to gauge market expectations of a stock is to look at its Price to Earnings Ratio (PE Ratio). Investors have optimistic expectations of companies with higher P/E ratios, compared to companies with lower P/E ratios.
View our latest analysis for Kaman
Does Kaman Have A Relatively High Or Low P/E For Its Industry?
We can tell from its P/E ratio of 18.65 that there is some investor optimism about Kaman. As you can see below, Kaman has a higher P/E than the average company (10.6) in the trade distributors industry.
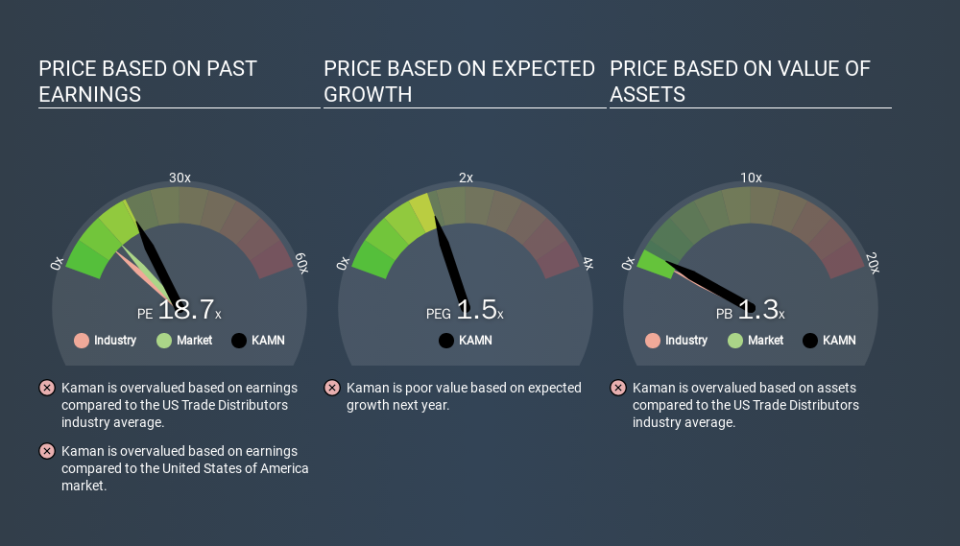
That means that the market expects Kaman will outperform other companies in its industry. Clearly the market expects growth, but it isn't guaranteed. So investors should always consider the P/E ratio alongside other factors, such as whether company directors have been buying shares.
How Growth Rates Impact P/E Ratios
Companies that shrink earnings per share quickly will rapidly decrease the 'E' in the equation. Therefore, even if you pay a low multiple of earnings now, that multiple will become higher in the future. A higher P/E should indicate the stock is expensive relative to others -- and that may encourage shareholders to sell.
Kaman's 256% EPS improvement over the last year was like bamboo growth after rain; rapid and impressive. Regrettably, the longer term performance is poor, with EPS down 3.6% per year over 5 years.
Don't Forget: The P/E Does Not Account For Debt or Bank Deposits
One drawback of using a P/E ratio is that it considers market capitalization, but not the balance sheet. That means it doesn't take debt or cash into account. In theory, a company can lower its future P/E ratio by using cash or debt to invest in growth.
Spending on growth might be good or bad a few years later, but the point is that the P/E ratio does not account for the option (or lack thereof).
Kaman's Balance Sheet
With net cash of US$288m, Kaman has a very strong balance sheet, which may be important for its business. Having said that, at 27% of its market capitalization the cash hoard would contribute towards a higher P/E ratio.
The Verdict On Kaman's P/E Ratio
Kaman has a P/E of 18.7. That's higher than the average in its market, which is 12.2. The excess cash it carries is the gravy on top its fast EPS growth. To us, this is the sort of company that we would expect to carry an above average price tag (relative to earnings). Given Kaman's P/E ratio has declined from 31.5 to 18.7 in the last month, we know for sure that the market is significantly less confident about the business today, than it was back then. For those who prefer to invest with the flow of momentum, that might be a bad sign, but for a contrarian, it may signal opportunity.
Investors should be looking to buy stocks that the market is wrong about. People often underestimate remarkable growth -- so investors can make money when fast growth is not fully appreciated. So this free visual report on analyst forecasts could hold the key to an excellent investment decision.
But note: Kaman may not be the best stock to buy. So take a peek at this free list of interesting companies with strong recent earnings growth (and a P/E ratio below 20).
If you spot an error that warrants correction, please contact the editor at editorial-team@simplywallst.com. This article by Simply Wall St is general in nature. It does not constitute a recommendation to buy or sell any stock, and does not take account of your objectives, or your financial situation. Simply Wall St has no position in the stocks mentioned.
We aim to bring you long-term focused research analysis driven by fundamental data. Note that our analysis may not factor in the latest price-sensitive company announcements or qualitative material. Thank you for reading.

