
 Yahoo Movies
 Read This Before You Buy Gates Industrial Corporation plc (NYSE:GTES) Because Of Its P/E Ratio

This article is written for those who want to get better at using price to earnings ratios (P/E ratios). We’ll show how you can use Gates Industrial Corporation plc’s (NYSE:GTES) P/E ratio to inform your assessment of the investment opportunity. Based on the last twelve months, Gates Industrial’s P/E ratio is 14.07. That corresponds to an earnings yield of approximately 7.1%.
View our latest analysis for Gates Industrial
How Do I Calculate A Price To Earnings Ratio?
The formula for price to earnings is:
Price to Earnings Ratio = Share Price ÷ Earnings per Share (EPS)
Or for Gates Industrial:
P/E of 14.07 = $14.77 ÷ $1.05 (Based on the trailing twelve months to September 2018.)
Is A High P/E Ratio Good?
A higher P/E ratio means that buyers have to pay a higher price for each $1 the company has earned over the last year. That isn’t a good or a bad thing on its own, but a high P/E means that buyers have a higher opinion of the business’s prospects, relative to stocks with a lower P/E.
How Growth Rates Impact P/E Ratios
Probably the most important factor in determining what P/E a company trades on is the earnings growth. That’s because companies that grow earnings per share quickly will rapidly increase the ‘E’ in the equation. That means even if the current P/E is high, it will reduce over time if the share price stays flat. Then, a lower P/E should attract more buyers, pushing the share price up.
Notably, Gates Industrial grew EPS by a whopping 486% in the last year. And earnings per share have improved by 79% annually, over the last three years. So we’d generally expect it to have a relatively high P/E ratio. Unfortunately, earnings per share are down 141% a year, over 5 years.
How Does Gates Industrial’s P/E Ratio Compare To Its Peers?
We can get an indication of market expectations by looking at the P/E ratio. If you look at the image below, you can see Gates Industrial has a lower P/E than the average (19.7) in the machinery industry classification.
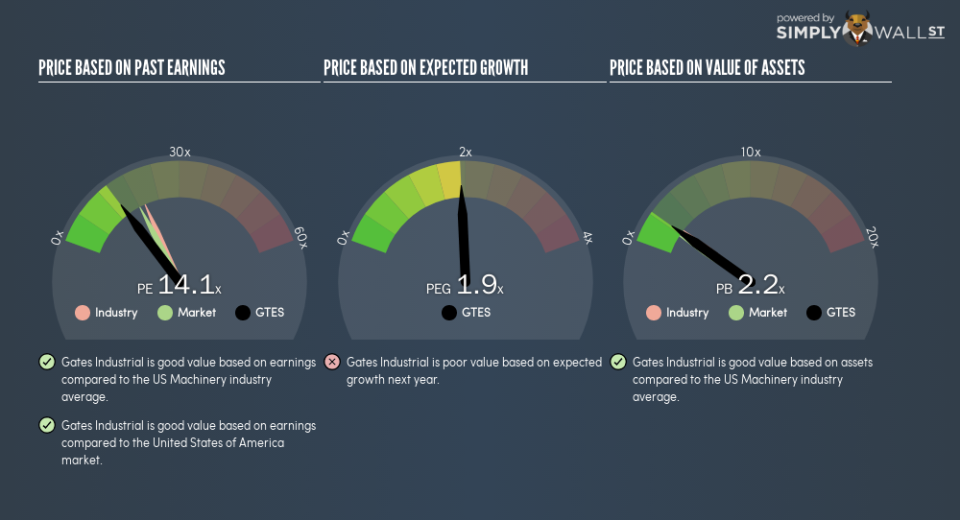
This suggests that market participants think Gates Industrial will underperform other companies in its industry. Since the market seems unimpressed with Gates Industrial, it’s quite possible it could surprise on the upside. It is arguably worth checking if insiders are buying shares, because that might imply they believe the stock is undervalued.
Don’t Forget: The P/E Does Not Account For Debt or Bank Deposits
It’s important to note that the P/E ratio considers the market capitalization, not the enterprise value. In other words, it does not consider any debt or cash that the company may have on the balance sheet. Hypothetically, a company could reduce its future P/E ratio by spending its cash (or taking on debt) to achieve higher earnings.
Spending on growth might be good or bad a few years later, but the point is that the P/E ratio does not account for the option (or lack thereof).
Gates Industrial’s Balance Sheet
Net debt totals 63% of Gates Industrial’s market cap. This is enough debt that you’d have to make some adjustments before using the P/E ratio to compare it to a company with net cash.
The Bottom Line On Gates Industrial’s P/E Ratio
Gates Industrial has a P/E of 14.1. That’s below the average in the US market, which is 18. While the EPS growth last year was strong, the significant debt levels reduce the number of options available to management. The low P/E ratio suggests current market expectations are muted, implying these levels of growth will not continue.
Investors should be looking to buy stocks that the market is wrong about. If it is underestimating a company, investors can make money by buying and holding the shares until the market corrects itself. So this free visual report on analyst forecasts could hold they key to an excellent investment decision.
Of course you might be able to find a better stock than Gates Industrial. So you may wish to see this free collection of other companies that have grown earnings strongly.
To help readers see past the short term volatility of the financial market, we aim to bring you a long-term focused research analysis purely driven by fundamental data. Note that our analysis does not factor in the latest price-sensitive company announcements.
The author is an independent contributor and at the time of publication had no position in the stocks mentioned. For errors that warrant correction please contact the editor at editorial-team@simplywallst.com.

