
 Yahoo Movies
 Can Mixed Fundamentals Have A Negative Impact on Seaboard Corporation (NYSEMKT:SEB) Current Share Price Momentum?
Seaboard's (NYSEMKT:SEB) stock is up by a considerable 11% over the past three months. But the company's key financial indicators appear to be differing across the board and that makes us question whether or not the company's current share price momentum can be maintained. Particularly, we will be paying attention to Seaboard's ROE today.
Return on equity or ROE is a key measure used to assess how efficiently a company's management is utilizing the company's capital. Simply put, it is used to assess the profitability of a company in relation to its equity capital.
See our latest analysis for Seaboard
How Do You Calculate Return On Equity?
The formula for ROE is:
Return on Equity = Net Profit (from continuing operations) ÷ Shareholders' Equity
So, based on the above formula, the ROE for Seaboard is:
5.4% = US$193m ÷ US$3.5b (Based on the trailing twelve months to September 2020).
The 'return' refers to a company's earnings over the last year. So, this means that for every $1 of its shareholder's investments, the company generates a profit of $0.05.
Why Is ROE Important For Earnings Growth?
We have already established that ROE serves as an efficient profit-generating gauge for a company's future earnings. Depending on how much of these profits the company reinvests or "retains", and how effectively it does so, we are then able to assess a company’s earnings growth potential. Assuming everything else remains unchanged, the higher the ROE and profit retention, the higher the growth rate of a company compared to companies that don't necessarily bear these characteristics.
A Side By Side comparison of Seaboard's Earnings Growth And 5.4% ROE
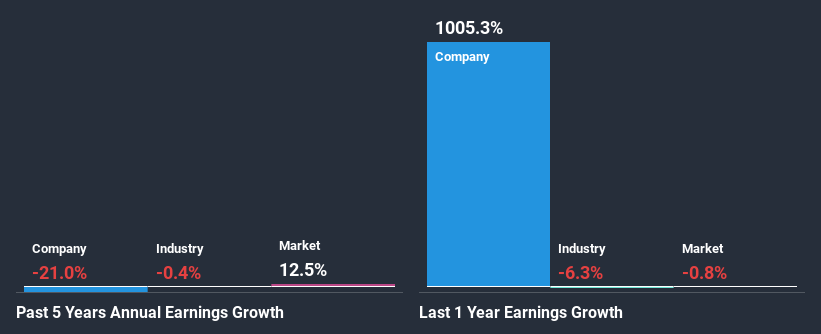
On the face of it, Seaboard's ROE is not much to talk about. Next, when compared to the average industry ROE of 9.3%, the company's ROE leaves us feeling even less enthusiastic. Given the circumstances, the significant decline in net income by 21% seen by Seaboard over the last five years is not surprising. We believe that there also might be other aspects that are negatively influencing the company's earnings prospects. For example, it is possible that the business has allocated capital poorly or that the company has a very high payout ratio.
Furthermore, even when compared to the industry, which has been shrinking its earnings at a rate 0.4% in the same period, we found that Seaboard's performance is pretty disappointing, as it suggests that the company has been shrunk its earnings at a rate faster than the industry.
Earnings growth is a huge factor in stock valuation. The investor should try to establish if the expected growth or decline in earnings, whichever the case may be, is priced in. This then helps them determine if the stock is placed for a bright or bleak future. One good indicator of expected earnings growth is the P/E ratio which determines the price the market is willing to pay for a stock based on its earnings prospects. So, you may want to check if Seaboard is trading on a high P/E or a low P/E, relative to its industry.
Is Seaboard Efficiently Re-investing Its Profits?
Seaboard's low three-year median payout ratio of 5.4% (implying that it retains the remaining 95% of its profits) comes as a surprise when you pair it with the shrinking earnings. This typically shouldn't be the case when a company is retaining most of its earnings. So there could be some other explanations in that regard. For example, the company's business may be deteriorating.
Additionally, Seaboard has paid dividends over a period of at least ten years, which means that the company's management is determined to pay dividends even if it means little to no earnings growth.
Summary
In total, we're a bit ambivalent about Seaboard's performance. While the company does have a high rate of profit retention, its low rate of return is probably hampering its earnings growth. Wrapping up, we would proceed with caution with this company and one way of doing that would be to look at the risk profile of the business. You can see the 1 risk we have identified for Seaboard by visiting our risks dashboard for free on our platform here.
This article by Simply Wall St is general in nature. It does not constitute a recommendation to buy or sell any stock, and does not take account of your objectives, or your financial situation. We aim to bring you long-term focused analysis driven by fundamental data. Note that our analysis may not factor in the latest price-sensitive company announcements or qualitative material. Simply Wall St has no position in any stocks mentioned.
Have feedback on this article? Concerned about the content? Get in touch with us directly. Alternatively, email editorial-team@simplywallst.com.

