
 Yahoo Movies
 John B. Sanfilippo & Son, Inc.'s (NASDAQ:JBSS) Stock Been Rising: Are Strong Financials Guiding The Market?
Most readers would already know that John B. Sanfilippo & Son's (NASDAQ:JBSS) stock increased by 3.3% over the past three months. Since the market usually pay for a company’s long-term financial health, we decided to study the company’s fundamentals to see if they could be influencing the market. In this article, we decided to focus on John B. Sanfilippo & Son's ROE.
Return on equity or ROE is an important factor to be considered by a shareholder because it tells them how effectively their capital is being reinvested. In short, ROE shows the profit each dollar generates with respect to its shareholder investments.
Check out our latest analysis for John B. Sanfilippo & Son
How To Calculate Return On Equity?
The formula for ROE is:
Return on Equity = Net Profit (from continuing operations) ÷ Shareholders' Equity
So, based on the above formula, the ROE for John B. Sanfilippo & Son is:
22% = US$58m ÷ US$269m (Based on the trailing twelve months to September 2022).
The 'return' refers to a company's earnings over the last year. That means that for every $1 worth of shareholders' equity, the company generated $0.22 in profit.
What Is The Relationship Between ROE And Earnings Growth?
Thus far, we have learned that ROE measures how efficiently a company is generating its profits. Based on how much of its profits the company chooses to reinvest or "retain", we are then able to evaluate a company's future ability to generate profits. Generally speaking, other things being equal, firms with a high return on equity and profit retention, have a higher growth rate than firms that don’t share these attributes.
A Side By Side comparison of John B. Sanfilippo & Son's Earnings Growth And 22% ROE
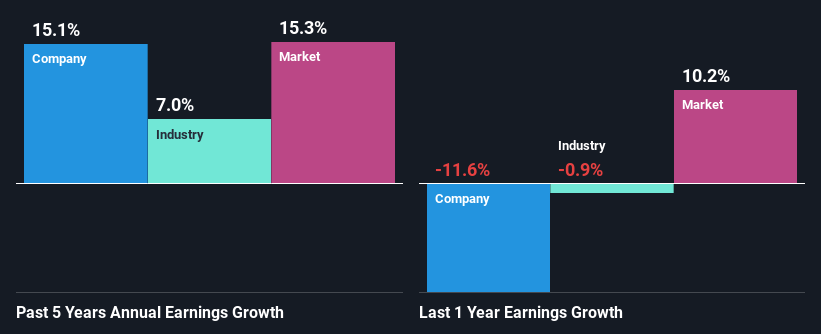
At first glance, John B. Sanfilippo & Son seems to have a decent ROE. Especially when compared to the industry average of 13% the company's ROE looks pretty impressive. Probably as a result of this, John B. Sanfilippo & Son was able to see a decent growth of 15% over the last five years.
We then compared John B. Sanfilippo & Son's net income growth with the industry and we're pleased to see that the company's growth figure is higher when compared with the industry which has a growth rate of 7.0% in the same period.
Earnings growth is a huge factor in stock valuation. What investors need to determine next is if the expected earnings growth, or the lack of it, is already built into the share price. By doing so, they will have an idea if the stock is headed into clear blue waters or if swampy waters await. If you're wondering about John B. Sanfilippo & Son's's valuation, check out this gauge of its price-to-earnings ratio, as compared to its industry.
Is John B. Sanfilippo & Son Efficiently Re-investing Its Profits?
John B. Sanfilippo & Son's three-year median payout ratio to shareholders is 14% (implying that it retains 86% of its income), which is on the lower side, so it seems like the management is reinvesting profits heavily to grow its business.
Moreover, John B. Sanfilippo & Son is determined to keep sharing its profits with shareholders which we infer from its long history of nine years of paying a dividend.
Conclusion
In total, we are pretty happy with John B. Sanfilippo & Son's performance. Specifically, we like that the company is reinvesting a huge chunk of its profits at a high rate of return. This of course has caused the company to see substantial growth in its earnings. If the company continues to grow its earnings the way it has, that could have a positive impact on its share price given how earnings per share influence long-term share prices. Remember, the price of a stock is also dependent on the perceived risk. Therefore investors must keep themselves informed about the risks involved before investing in any company. You can see the 1 risk we have identified for John B. Sanfilippo & Son by visiting our risks dashboard for free on our platform here.
Have feedback on this article? Concerned about the content? Get in touch with us directly. Alternatively, email editorial-team (at) simplywallst.com.
This article by Simply Wall St is general in nature. We provide commentary based on historical data and analyst forecasts only using an unbiased methodology and our articles are not intended to be financial advice. It does not constitute a recommendation to buy or sell any stock, and does not take account of your objectives, or your financial situation. We aim to bring you long-term focused analysis driven by fundamental data. Note that our analysis may not factor in the latest price-sensitive company announcements or qualitative material. Simply Wall St has no position in any stocks mentioned.
Join A Paid User Research Session
You’ll receive a US$30 Amazon Gift card for 1 hour of your time while helping us build better investing tools for the individual investors like yourself. Sign up here

