
 Yahoo Movies
 Institutions own 40% of Baidu, Inc. (NASDAQ:BIDU) shares but individual investors control 40% of the company
Key Insights
Significant control over Baidu by individual investors implies that the general public has more power to influence management and governance-related decisions
43% of the business is held by the top 25 shareholders
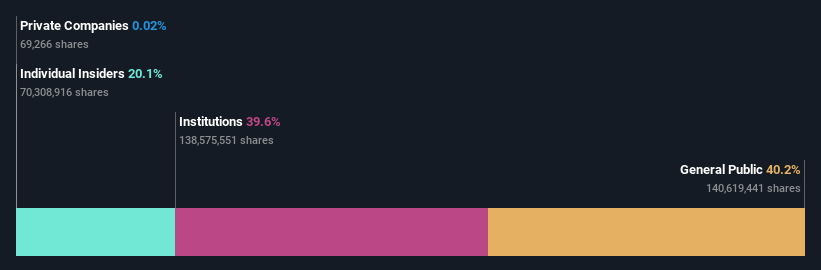
To get a sense of who is truly in control of Baidu, Inc. (NASDAQ:BIDU), it is important to understand the ownership structure of the business. The group holding the most number of shares in the company, around 40% to be precise, is individual investors. That is, the group stands to benefit the most if the stock rises (or lose the most if there is a downturn).
Meanwhile, institutions make up 40% of the company’s shareholders. Institutions often own shares in more established companies, while it's not unusual to see insiders own a fair bit of smaller companies.
Let's delve deeper into each type of owner of Baidu, beginning with the chart below.
View our latest analysis for Baidu
What Does The Institutional Ownership Tell Us About Baidu?
Institutions typically measure themselves against a benchmark when reporting to their own investors, so they often become more enthusiastic about a stock once it's included in a major index. We would expect most companies to have some institutions on the register, especially if they are growing.
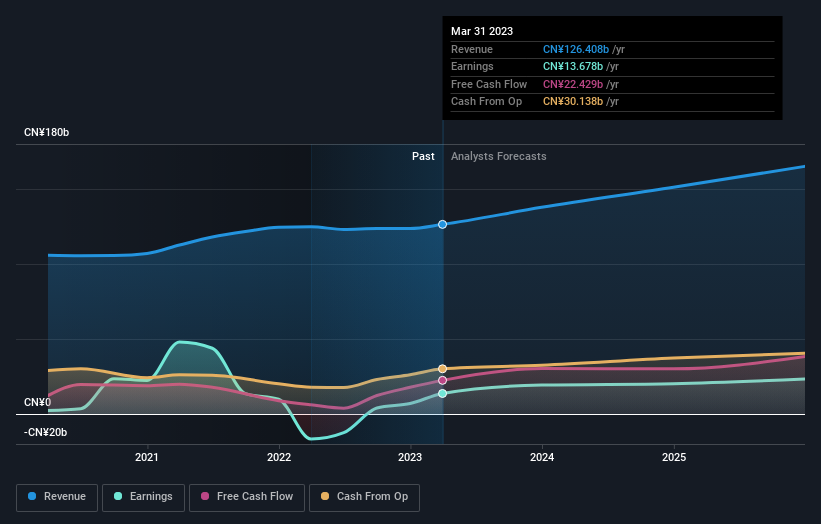
Baidu already has institutions on the share registry. Indeed, they own a respectable stake in the company. This suggests some credibility amongst professional investors. But we can't rely on that fact alone since institutions make bad investments sometimes, just like everyone does. If multiple institutions change their view on a stock at the same time, you could see the share price drop fast. It's therefore worth looking at Baidu's earnings history below. Of course, the future is what really matters.
Baidu is not owned by hedge funds. Looking at our data, we can see that the largest shareholder is the CEO Yanhong Li with 20% of shares outstanding. In comparison, the second and third largest shareholders hold about 3.6% and 3.2% of the stock.
On studying our ownership data, we found that 25 of the top shareholders collectively own less than 50% of the share register, implying that no single individual has a majority interest.
Researching institutional ownership is a good way to gauge and filter a stock's expected performance. The same can be achieved by studying analyst sentiments. There are a reasonable number of analysts covering the stock, so it might be useful to find out their aggregate view on the future.
Insider Ownership Of Baidu
While the precise definition of an insider can be subjective, almost everyone considers board members to be insiders. Company management run the business, but the CEO will answer to the board, even if he or she is a member of it.
Insider ownership is positive when it signals leadership are thinking like the true owners of the company. However, high insider ownership can also give immense power to a small group within the company. This can be negative in some circumstances.
It seems insiders own a significant proportion of Baidu, Inc.. It has a market capitalization of just US$50b, and insiders have US$10b worth of shares in their own names. That's quite significant. It is good to see this level of investment. You can check here to see if those insiders have been buying recently.
General Public Ownership
With a 40% ownership, the general public, mostly comprising of individual investors, have some degree of sway over Baidu. While this size of ownership may not be enough to sway a policy decision in their favour, they can still make a collective impact on company policies.
Next Steps:
I find it very interesting to look at who exactly owns a company. But to truly gain insight, we need to consider other information, too.
I like to dive deeper into how a company has performed in the past. You can access this interactive graph of past earnings, revenue and cash flow, for free.
Ultimately the future is most important. You can access this free report on analyst forecasts for the company.
NB: Figures in this article are calculated using data from the last twelve months, which refer to the 12-month period ending on the last date of the month the financial statement is dated. This may not be consistent with full year annual report figures.
Have feedback on this article? Concerned about the content? Get in touch with us directly. Alternatively, email editorial-team (at) simplywallst.com.
This article by Simply Wall St is general in nature. We provide commentary based on historical data and analyst forecasts only using an unbiased methodology and our articles are not intended to be financial advice. It does not constitute a recommendation to buy or sell any stock, and does not take account of your objectives, or your financial situation. We aim to bring you long-term focused analysis driven by fundamental data. Note that our analysis may not factor in the latest price-sensitive company announcements or qualitative material. Simply Wall St has no position in any stocks mentioned.
Join A Paid User Research Session
You’ll receive a US$30 Amazon Gift card for 1 hour of your time while helping us build better investing tools for the individual investors like yourself. Sign up here

