
 Yahoo Movies
 Imagine Owning SLM (NASDAQ:SLM) And Wondering If The 46% Share Price Slide Is Justified

Many investors define successful investing as beating the market average over the long term. But its virtually certain that sometimes you will buy stocks that fall short of the market average returns. Unfortunately, that's been the case for longer term SLM Corporation (NASDAQ:SLM) shareholders, since the share price is down 46% in the last three years, falling well short of the market return of around 26%. And the ride hasn't got any smoother in recent times over the last year, with the price 31% lower in that time. The falls have accelerated recently, with the share price down 25% in the last three months. However, one could argue that the price has been influenced by the general market, which is down 15% in the same timeframe.
View our latest analysis for SLM
To quote Buffett, 'Ships will sail around the world but the Flat Earth Society will flourish. There will continue to be wide discrepancies between price and value in the marketplace...' By comparing earnings per share (EPS) and share price changes over time, we can get a feel for how investor attitudes to a company have morphed over time.
During the unfortunate three years of share price decline, SLM actually saw its earnings per share (EPS) improve by 35% per year. Given the share price reaction, one might suspect that EPS is not a good guide to the business performance during the period (perhaps due to a one-off loss or gain). Or else the company was over-hyped in the past, and so its growth has disappointed.
Since the change in EPS doesn't seem to correlate with the change in share price, it's worth taking a look at other metrics.
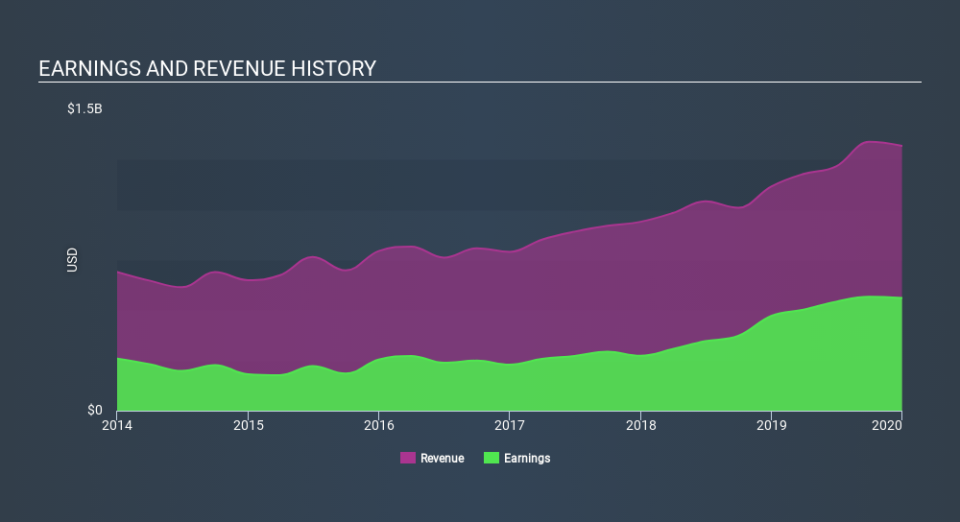
The modest 1.8% dividend yield is unlikely to be guiding the market view of the stock. We note that, in three years, revenue has actually grown at a 17% annual rate, so that doesn't seem to be a reason to sell shares. It's probably worth investigating SLM further; while we may be missing something on this analysis, there might also be an opportunity.
You can see how earnings and revenue have changed over time in the image below (click on the chart to see the exact values).
We know that SLM has improved its bottom line over the last three years, but what does the future have in store? This free interactive report on SLM's balance sheet strength is a great place to start, if you want to investigate the stock further.
A Different Perspective
While the broader market lost about 0.8% in the twelve months, SLM shareholders did even worse, losing 30% (even including dividends) . Having said that, it's inevitable that some stocks will be oversold in a falling market. The key is to keep your eyes on the fundamental developments. Regrettably, last year's performance caps off a bad run, with the shareholders facing a total loss of 7.7% per year over five years. We realise that Baron Rothschild has said investors should "buy when there is blood on the streets", but we caution that investors should first be sure they are buying a high quality business. I find it very interesting to look at share price over the long term as a proxy for business performance. But to truly gain insight, we need to consider other information, too. Consider for instance, the ever-present spectre of investment risk. We've identified 2 warning signs with SLM (at least 1 which is a bit concerning) , and understanding them should be part of your investment process.
But note: SLM may not be the best stock to buy. So take a peek at this free list of interesting companies with past earnings growth (and further growth forecast).
Please note, the market returns quoted in this article reflect the market weighted average returns of stocks that currently trade on US exchanges.
If you spot an error that warrants correction, please contact the editor at editorial-team@simplywallst.com. This article by Simply Wall St is general in nature. It does not constitute a recommendation to buy or sell any stock, and does not take account of your objectives, or your financial situation. Simply Wall St has no position in the stocks mentioned.
We aim to bring you long-term focused research analysis driven by fundamental data. Note that our analysis may not factor in the latest price-sensitive company announcements or qualitative material. Thank you for reading.

