
 Yahoo Movies
 HNI (NYSE:HNI) Share Prices Have Dropped 14% In The Last Three Years
In order to justify the effort of selecting individual stocks, it's worth striving to beat the returns from a market index fund. But its virtually certain that sometimes you will buy stocks that fall short of the market average returns. Unfortunately, that's been the case for longer term HNI Corporation (NYSE:HNI) shareholders, since the share price is down 14% in the last three years, falling well short of the market return of around 47%.
Check out our latest analysis for HNI
To quote Buffett, 'Ships will sail around the world but the Flat Earth Society will flourish. There will continue to be wide discrepancies between price and value in the marketplace...' One imperfect but simple way to consider how the market perception of a company has shifted is to compare the change in the earnings per share (EPS) with the share price movement.
Although the share price is down over three years, HNI actually managed to grow EPS by 1.1% per year in that time. Given the share price reaction, one might suspect that EPS is not a good guide to the business performance during the period (perhaps due to a one-off loss or gain). Or else the company was over-hyped in the past, and so its growth has disappointed.
Given that EPS is up and the share price is down, it seems clear the market is less excited about the business than it was. Of course, this could spell opportunity because if the EPS growth continues long term, it seems very likely the share price will rise too.
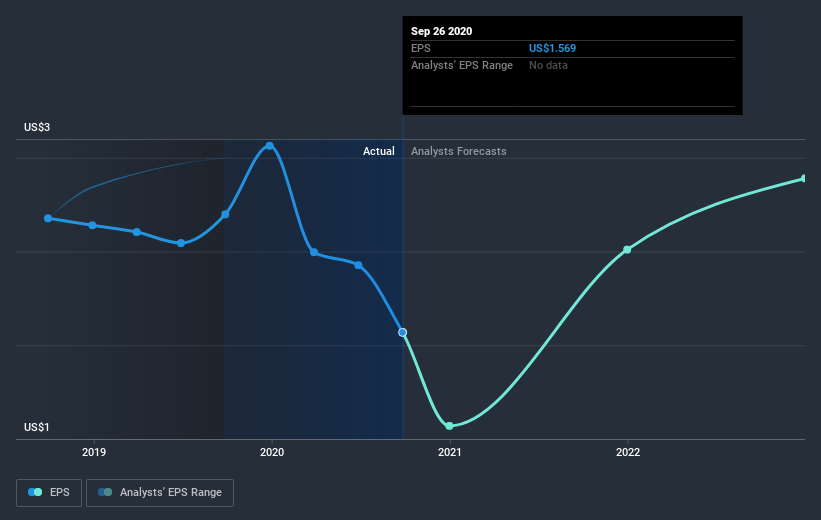
You can see how EPS has changed over time in the image below (click on the chart to see the exact values).
Dive deeper into HNI's key metrics by checking this interactive graph of HNI's earnings, revenue and cash flow.
What About Dividends?
It is important to consider the total shareholder return, as well as the share price return, for any given stock. The TSR is a return calculation that accounts for the value of cash dividends (assuming that any dividend received was reinvested) and the calculated value of any discounted capital raisings and spin-offs. It's fair to say that the TSR gives a more complete picture for stocks that pay a dividend. In the case of HNI, it has a TSR of -4.3% for the last 3 years. That exceeds its share price return that we previously mentioned. This is largely a result of its dividend payments!
A Different Perspective
HNI shareholders are down 4.8% for the year (even including dividends), but the market itself is up 25%. Even the share prices of good stocks drop sometimes, but we want to see improvements in the fundamental metrics of a business, before getting too interested. Longer term investors wouldn't be so upset, since they would have made 4%, each year, over five years. If the fundamental data continues to indicate long term sustainable growth, the current sell-off could be an opportunity worth considering. It's always interesting to track share price performance over the longer term. But to understand HNI better, we need to consider many other factors. To that end, you should be aware of the 1 warning sign we've spotted with HNI .
Of course, you might find a fantastic investment by looking elsewhere. So take a peek at this free list of companies we expect will grow earnings.
Please note, the market returns quoted in this article reflect the market weighted average returns of stocks that currently trade on US exchanges.
This article by Simply Wall St is general in nature. It does not constitute a recommendation to buy or sell any stock, and does not take account of your objectives, or your financial situation. We aim to bring you long-term focused analysis driven by fundamental data. Note that our analysis may not factor in the latest price-sensitive company announcements or qualitative material. Simply Wall St has no position in any stocks mentioned.
Have feedback on this article? Concerned about the content? Get in touch with us directly. Alternatively, email editorial-team (at) simplywallst.com.

