
 Yahoo Movies
 What Is eGain's (NASDAQ:EGAN) P/E Ratio After Its Share Price Rocketed?

The eGain (NASDAQ:EGAN) share price has done well in the last month, posting a gain of 31%. But shareholders may not all be feeling jubilant, since the share price is still down 13% in the last year.
All else being equal, a sharp share price increase should make a stock less attractive to potential investors. While the market sentiment towards a stock is very changeable, in the long run, the share price will tend to move in the same direction as earnings per share. The implication here is that deep value investors might steer clear when expectations of a company are too high. Perhaps the simplest way to get a read on investors' expectations of a business is to look at its Price to Earnings Ratio (PE Ratio). A high P/E ratio means that investors have a high expectation about future growth, while a low P/E ratio means they have low expectations about future growth.
Check out our latest analysis for eGain
How Does eGain's P/E Ratio Compare To Its Peers?
eGain's P/E of 63.21 indicates some degree of optimism towards the stock. The image below shows that eGain has a higher P/E than the average (47.0) P/E for companies in the software industry.
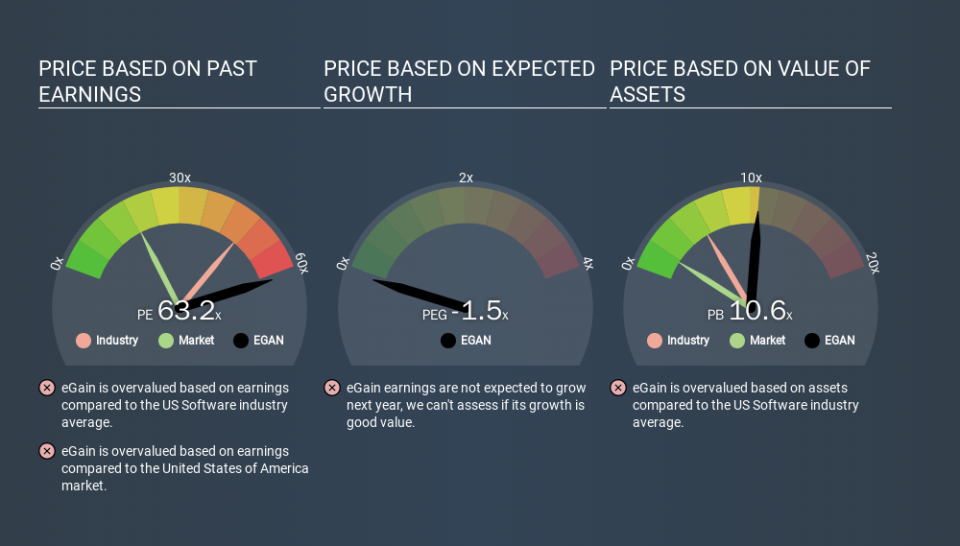
eGain's P/E tells us that market participants think the company will perform better than its industry peers, going forward. Shareholders are clearly optimistic, but the future is always uncertain. So further research is always essential. I often monitor director buying and selling.
How Growth Rates Impact P/E Ratios
Earnings growth rates have a big influence on P/E ratios. Earnings growth means that in the future the 'E' will be higher. Therefore, even if you pay a high multiple of earnings now, that multiple will become lower in the future. And as that P/E ratio drops, the company will look cheap, unless its share price increases.
eGain's earnings made like a rocket, taking off 123% last year.
A Limitation: P/E Ratios Ignore Debt and Cash In The Bank
One drawback of using a P/E ratio is that it considers market capitalization, but not the balance sheet. Thus, the metric does not reflect cash or debt held by the company. Hypothetically, a company could reduce its future P/E ratio by spending its cash (or taking on debt) to achieve higher earnings.
Such spending might be good or bad, overall, but the key point here is that you need to look at debt to understand the P/E ratio in context.
How Does eGain's Debt Impact Its P/E Ratio?
With net cash of US$40m, eGain has a very strong balance sheet, which may be important for its business. Having said that, at 13% of its market capitalization the cash hoard would contribute towards a higher P/E ratio.
The Bottom Line On eGain's P/E Ratio
eGain's P/E is 63.2 which suggests the market is more focussed on the future opportunity rather than the current level of earnings. Its net cash position is the cherry on top of its superb EPS growth. So based on this analysis we'd expect eGain to have a high P/E ratio. What is very clear is that the market has become significantly more optimistic about eGain over the last month, with the P/E ratio rising from 48.3 back then to 63.2 today. For those who prefer to invest with the flow of momentum, that might mean it's time to put the stock on a watchlist, or research it. But the contrarian may see it as a missed opportunity.
When the market is wrong about a stock, it gives savvy investors an opportunity. As value investor Benjamin Graham famously said, 'In the short run, the market is a voting machine but in the long run, it is a weighing machine. So this free report on the analyst consensus forecasts could help you make a master move on this stock.
But note: eGain may not be the best stock to buy. So take a peek at this free list of interesting companies with strong recent earnings growth (and a P/E ratio below 20).
If you spot an error that warrants correction, please contact the editor at editorial-team@simplywallst.com. This article by Simply Wall St is general in nature. It does not constitute a recommendation to buy or sell any stock, and does not take account of your objectives, or your financial situation. Simply Wall St has no position in the stocks mentioned.
We aim to bring you long-term focused research analysis driven by fundamental data. Note that our analysis may not factor in the latest price-sensitive company announcements or qualitative material. Thank you for reading.

