
 Yahoo Movies
 Does Kimball Electronics, Inc. (NASDAQ:KE) Have A Good P/E Ratio?

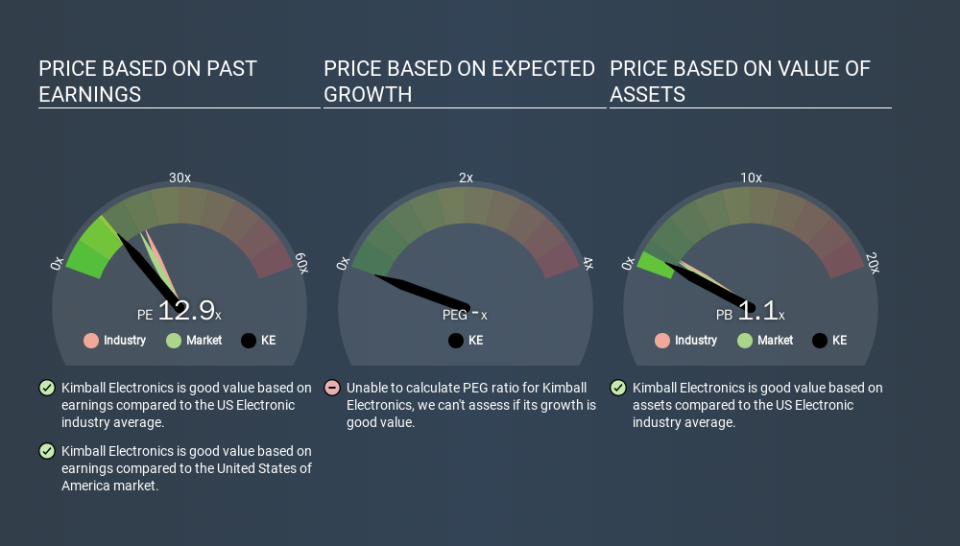
This article is written for those who want to get better at using price to earnings ratios (P/E ratios). To keep it practical, we'll show how Kimball Electronics, Inc.'s (NASDAQ:KE) P/E ratio could help you assess the value on offer. Kimball Electronics has a price to earnings ratio of 12.93, based on the last twelve months. That means that at current prices, buyers pay $12.93 for every $1 in trailing yearly profits.
Check out our latest analysis for Kimball Electronics
How Do You Calculate A P/E Ratio?
The formula for price to earnings is:
Price to Earnings Ratio = Price per Share ÷ Earnings per Share (EPS)
Or for Kimball Electronics:
P/E of 12.93 = USD16.69 ÷ USD1.29 (Based on the year to September 2019.)
Is A High P/E Ratio Good?
A higher P/E ratio means that buyers have to pay a higher price for each USD1 the company has earned over the last year. That isn't necessarily good or bad, but a high P/E implies relatively high expectations of what a company can achieve in the future.
Does Kimball Electronics Have A Relatively High Or Low P/E For Its Industry?
We can get an indication of market expectations by looking at the P/E ratio. If you look at the image below, you can see Kimball Electronics has a lower P/E than the average (20.9) in the electronic industry classification.
Its relatively low P/E ratio indicates that Kimball Electronics shareholders think it will struggle to do as well as other companies in its industry classification. Since the market seems unimpressed with Kimball Electronics, it's quite possible it could surprise on the upside. You should delve deeper. I like to check if company insiders have been buying or selling.
How Growth Rates Impact P/E Ratios
Earnings growth rates have a big influence on P/E ratios. That's because companies that grow earnings per share quickly will rapidly increase the 'E' in the equation. And in that case, the P/E ratio itself will drop rather quickly. Then, a lower P/E should attract more buyers, pushing the share price up.
Kimball Electronics's 158% EPS improvement over the last year was like bamboo growth after rain; rapid and impressive. Having said that, if we look back three years, EPS growth has averaged a comparatively less impressive 9.8%.
Remember: P/E Ratios Don't Consider The Balance Sheet
The 'Price' in P/E reflects the market capitalization of the company. That means it doesn't take debt or cash into account. Theoretically, a business can improve its earnings (and produce a lower P/E in the future) by investing in growth. That means taking on debt (or spending its cash).
Spending on growth might be good or bad a few years later, but the point is that the P/E ratio does not account for the option (or lack thereof).
How Does Kimball Electronics's Debt Impact Its P/E Ratio?
Kimball Electronics's net debt is 13% of its market cap. That's enough debt to impact the P/E ratio a little; so keep it in mind if you're comparing it to companies without debt.
The Verdict On Kimball Electronics's P/E Ratio
Kimball Electronics's P/E is 12.9 which is below average (18.5) in the US market. The EPS growth last year was strong, and debt levels are quite reasonable. If it continues to grow, then the current low P/E may prove to be unjustified.
Investors have an opportunity when market expectations about a stock are wrong. As value investor Benjamin Graham famously said, 'In the short run, the market is a voting machine but in the long run, it is a weighing machine. Although we don't have analyst forecasts shareholders might want to examine this detailed historical graph of earnings, revenue and cash flow.
You might be able to find a better buy than Kimball Electronics. If you want a selection of possible winners, check out this free list of interesting companies that trade on a P/E below 20 (but have proven they can grow earnings).
If you spot an error that warrants correction, please contact the editor at editorial-team@simplywallst.com. This article by Simply Wall St is general in nature. It does not constitute a recommendation to buy or sell any stock, and does not take account of your objectives, or your financial situation. Simply Wall St has no position in the stocks mentioned.
We aim to bring you long-term focused research analysis driven by fundamental data. Note that our analysis may not factor in the latest price-sensitive company announcements or qualitative material. Thank you for reading.

