
 Yahoo Movies
 How Does B&G Foods's (NYSE:BGS) P/E Compare To Its Industry, After Its Big Share Price Gain?

B&G Foods (NYSE:BGS) shareholders are no doubt pleased to see that the share price has had a great month, posting a 48% gain, recovering from prior weakness. But shareholders may not all be feeling jubilant, since the share price is still down 28% in the last year.
Assuming no other changes, a sharply higher share price makes a stock less attractive to potential buyers. In the long term, share prices tend to follow earnings per share, but in the short term prices bounce around in response to short term factors (which are not always obvious). So some would prefer to hold off buying when there is a lot of optimism towards a stock. One way to gauge market expectations of a stock is to look at its Price to Earnings Ratio (PE Ratio). A high P/E implies that investors have high expectations of what a company can achieve compared to a company with a low P/E ratio.
See our latest analysis for B&G Foods
How Does B&G Foods's P/E Ratio Compare To Its Peers?
We can tell from its P/E ratio of 14.62 that sentiment around B&G Foods isn't particularly high. If you look at the image below, you can see B&G Foods has a lower P/E than the average (20.6) in the food industry classification.
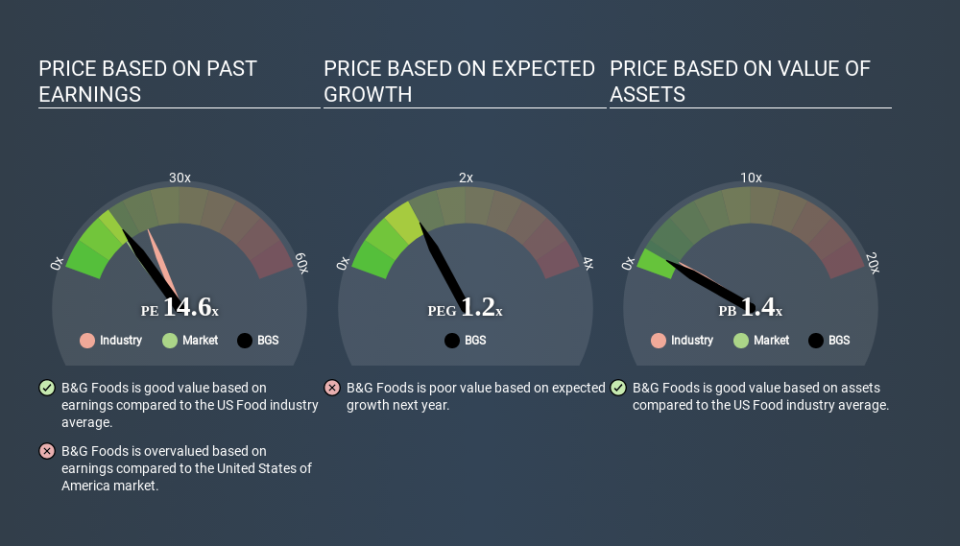
This suggests that market participants think B&G Foods will underperform other companies in its industry. Since the market seems unimpressed with B&G Foods, it's quite possible it could surprise on the upside. You should delve deeper. I like to check if company insiders have been buying or selling.
How Growth Rates Impact P/E Ratios
Companies that shrink earnings per share quickly will rapidly decrease the 'E' in the equation. Therefore, even if you pay a low multiple of earnings now, that multiple will become higher in the future. So while a stock may look cheap based on past earnings, it could be expensive based on future earnings.
B&G Foods's earnings per share fell by 55% in the last twelve months. But it has grown its earnings per share by 9.0% per year over the last five years. And over the longer term (3 years) earnings per share have decreased 12% annually. This could justify a low P/E.
A Limitation: P/E Ratios Ignore Debt and Cash In The Bank
The 'Price' in P/E reflects the market capitalization of the company. So it won't reflect the advantage of cash, or disadvantage of debt. In theory, a company can lower its future P/E ratio by using cash or debt to invest in growth.
While growth expenditure doesn't always pay off, the point is that it is a good option to have; but one that the P/E ratio ignores.
So What Does B&G Foods's Balance Sheet Tell Us?
B&G Foods has net debt worth a very significant 170% of its market capitalization. If you want to compare its P/E ratio to other companies, you must keep in mind that these debt levels would usually warrant a relatively low P/E.
The Verdict On B&G Foods's P/E Ratio
B&G Foods trades on a P/E ratio of 14.6, which is fairly close to the US market average of 14.0. With significant debt and no EPS growth last year, the P/E suggests shareholders are expecting higher profit in the future. What we know for sure is that investors have become more excited about B&G Foods recently, since they have pushed its P/E ratio from 9.9 to 14.6 over the last month. For those who prefer to invest with the flow of momentum, that might mean it's time to put the stock on a watchlist, or research it. But the contrarian may see it as a missed opportunity.
Investors should be looking to buy stocks that the market is wrong about. If the reality for a company is better than it expects, you can make money by buying and holding for the long term. So this free visualization of the analyst consensus on future earnings could help you make the right decision about whether to buy, sell, or hold.
You might be able to find a better buy than B&G Foods. If you want a selection of possible winners, check out this free list of interesting companies that trade on a P/E below 20 (but have proven they can grow earnings).
If you spot an error that warrants correction, please contact the editor at editorial-team@simplywallst.com. This article by Simply Wall St is general in nature. It does not constitute a recommendation to buy or sell any stock, and does not take account of your objectives, or your financial situation. Simply Wall St has no position in the stocks mentioned.
We aim to bring you long-term focused research analysis driven by fundamental data. Note that our analysis may not factor in the latest price-sensitive company announcements or qualitative material. Thank you for reading.

