
 Yahoo Movies
 How Did STAAR Surgical Company’s (NASDAQ:STAA) 1.41% ROE Fare Against The Industry?

I am writing today to help inform people who are new to the stock market and looking to gauge the potential return on investment in STAAR Surgical Company (NASDAQ:STAA).
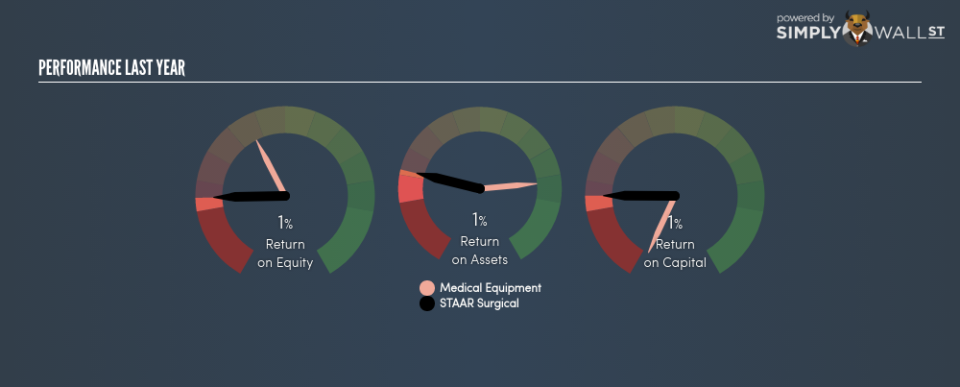
STAAR Surgical Company’s (NASDAQ:STAA) most recent return on equity was a substandard 1.41% relative to its industry performance of 11.63% over the past year. STAA’s results could indicate a relatively inefficient operation to its peers, and while this may be the case, it is important to understand what ROE is made up of and how it should be interpreted. Knowing these components could change your view on STAA’s performance. Today I will look at how components such as financial leverage can influence ROE which may impact the sustainability of STAA’s returns. View out our latest analysis for STAAR Surgical
Breaking down ROE — the mother of all ratios
Return on Equity (ROE) is a measure of STAAR Surgical’s profit relative to its shareholders’ equity. An ROE of 1.41% implies $0.014 returned on every $1 invested. Generally speaking, a higher ROE is preferred; however, there are other factors we must also consider before making any conclusions.
Return on Equity = Net Profit ÷ Shareholders Equity
ROE is assessed against cost of equity, which is measured using the Capital Asset Pricing Model (CAPM) – but let’s not dive into the details of that today. For now, let’s just look at the cost of equity number for STAAR Surgical, which is 8.59%. This means STAAR Surgical’s returns actually do not cover its own cost of equity, with a discrepancy of -7.18%. This isn’t sustainable as it implies, very simply, that the company pays more for its capital than what it generates in return. ROE can be split up into three useful ratios: net profit margin, asset turnover, and financial leverage. This is called the Dupont Formula:
Dupont Formula
ROE = profit margin × asset turnover × financial leverage
ROE = (annual net profit ÷ sales) × (sales ÷ assets) × (assets ÷ shareholders’ equity)
ROE = annual net profit ÷ shareholders’ equity
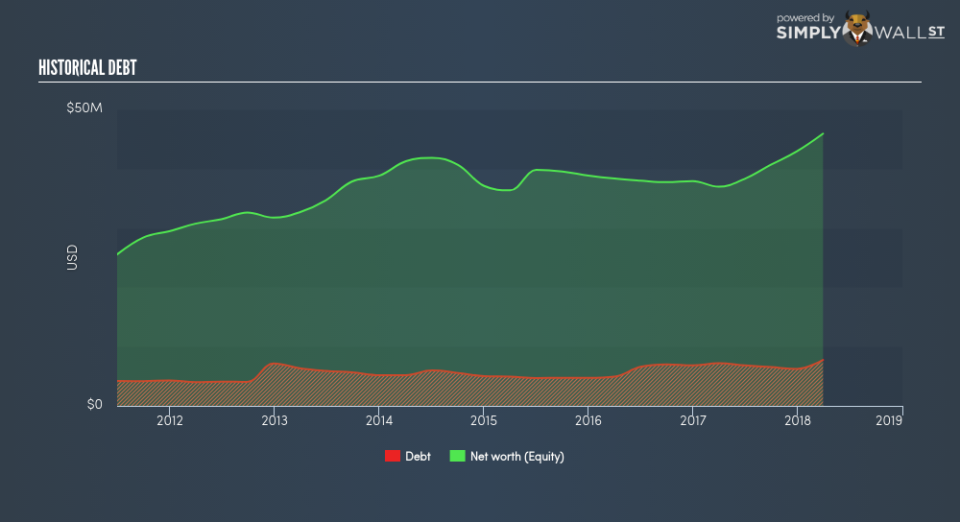
The first component is profit margin, which measures how much of sales is retained after the company pays for all its expenses. The other component, asset turnover, illustrates how much revenue STAAR Surgical can make from its asset base. The most interesting ratio, and reflective of sustainability of its ROE, is financial leverage. Since financial leverage can artificially inflate ROE, we need to look at how much debt STAAR Surgical currently has. At 16.89%, STAAR Surgical’s debt-to-equity ratio appears low and indicates that STAAR Surgical still has room to increase leverage and grow its profits.
Next Steps:
ROE is a simple yet informative ratio, illustrating the various components that each measure the quality of the overall stock. STAAR Surgical exhibits a weak ROE against its peers, as well as insufficient levels to cover its own cost of equity this year. However, ROE is not likely to be inflated by excessive debt funding, giving shareholders more conviction in the sustainability of returns, which has headroom to increase further. ROE is a helpful signal, but it is definitely not sufficient on its own to make an investment decision.
For STAAR Surgical, I’ve put together three essential factors you should look at:
Financial Health: Does it have a healthy balance sheet? Take a look at our free balance sheet analysis with six simple checks on key factors like leverage and risk.
Valuation: What is STAAR Surgical worth today? Is the stock undervalued, even when its growth outlook is factored into its intrinsic value? The intrinsic value infographic in our free research report helps visualize whether STAAR Surgical is currently mispriced by the market.
Other High-Growth Alternatives : Are there other high-growth stocks you could be holding instead of STAAR Surgical? Explore our interactive list of stocks with large growth potential to get an idea of what else is out there you may be missing!
To help readers see pass the short term volatility of the financial market, we aim to bring you a long-term focused research analysis purely driven by fundamental data. Note that our analysis does not factor in the latest price sensitive company announcements.
The author is an independent contributor and at the time of publication had no position in the stocks mentioned.

