
 Yahoo Movies
 How Did Rogers Corporation’s (NYSE:ROG) 9.4% ROE Fare Against The Industry?

I am writing today to help inform people who are new to the stock market and want to start learning about core concepts of fundamental analysis on practical examples from today’s market.
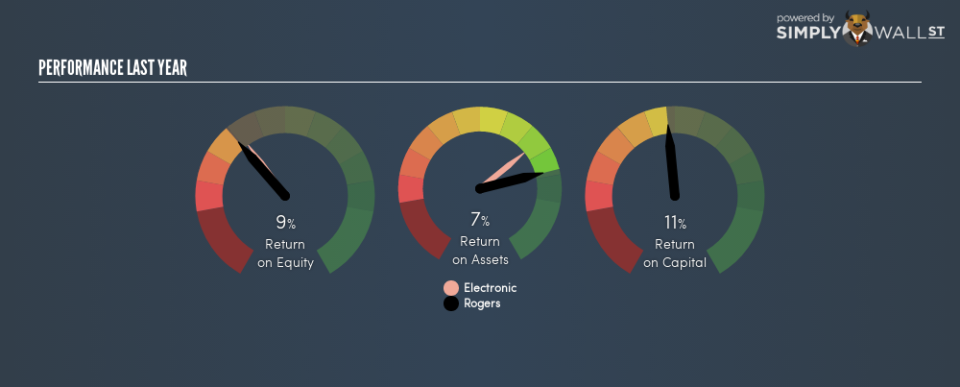
Rogers Corporation (NYSE:ROG) delivered a less impressive 9.4% ROE over the past year, compared to the 10.2% return generated by its industry. Though ROG’s recent performance is underwhelming, it is useful to understand what ROE is made up of and how it should be interpreted. Knowing these components can change your views on ROG’s below-average returns. Metrics such as financial leverage can impact the level of ROE which in turn can affect the sustainability of ROG’s returns. Let me show you what I mean by this.
Check out our latest analysis for Rogers
What you must know about ROE
Firstly, Return on Equity, or ROE, is simply the percentage of last years’ earning against the book value of shareholders’ equity. It essentially shows how much the company can generate in earnings given the amount of equity it has raised. Generally speaking, a higher ROE is preferred; however, there are other factors we must also consider before making any conclusions.
Return on Equity = Net Profit ÷ Shareholders Equity
ROE is assessed against cost of equity, which is measured using the Capital Asset Pricing Model (CAPM) – but let’s not dive into the details of that today. For now, let’s just look at the cost of equity number for Rogers, which is 10.6%. Since Rogers’s return does not cover its cost, with a difference of -1.2%, this means its current use of equity is not efficient and not sustainable. Very simply, Rogers pays more for its capital than what it generates in return. ROE can be dissected into three distinct ratios: net profit margin, asset turnover, and financial leverage. This is called the Dupont Formula:
Dupont Formula
ROE = profit margin × asset turnover × financial leverage
ROE = (annual net profit ÷ sales) × (sales ÷ assets) × (assets ÷ shareholders’ equity)
ROE = annual net profit ÷ shareholders’ equity
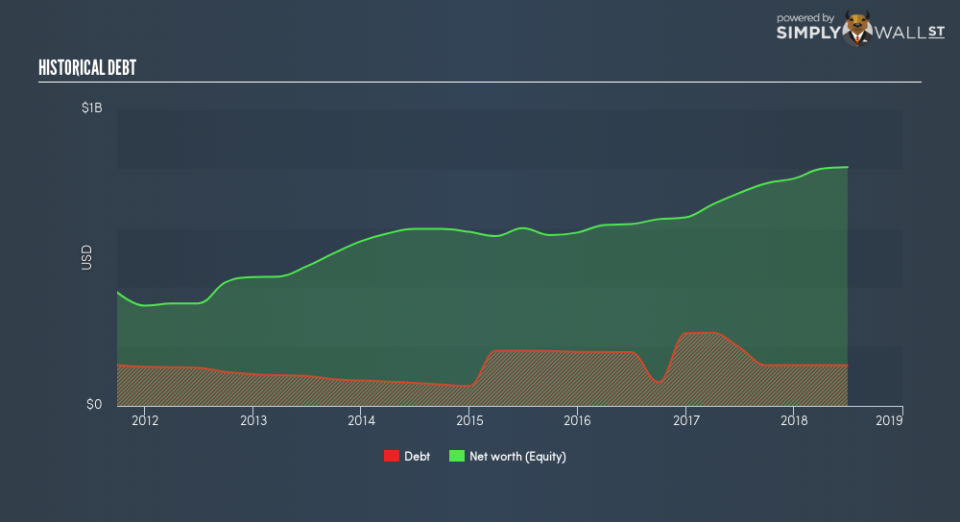
Basically, profit margin measures how much of revenue trickles down into earnings which illustrates how efficient the business is with its cost management. The other component, asset turnover, illustrates how much revenue Rogers can make from its asset base. And finally, financial leverage is simply how much of assets are funded by equity, which exhibits how sustainable the company’s capital structure is. Since financial leverage can artificially inflate ROE, we need to look at how much debt Rogers currently has. At 17.0%, Rogers’s debt-to-equity ratio appears low and indicates that Rogers still has room to increase leverage and grow its profits.
Next Steps:
While ROE is a relatively simple calculation, it can be broken down into different ratios, each telling a different story about the strengths and weaknesses of a company. Rogers exhibits a weak ROE against its peers, as well as insufficient levels to cover its own cost of equity this year. Although, its appropriate level of leverage means investors can be more confident in the sustainability of Rogers’s return with a possible increase should the company decide to increase its debt levels. ROE is a helpful signal, but it is definitely not sufficient on its own to make an investment decision.
For Rogers, I’ve compiled three relevant aspects you should further research:
Financial Health: Does it have a healthy balance sheet? Take a look at our free balance sheet analysis with six simple checks on key factors like leverage and risk.
Valuation: What is Rogers worth today? Is the stock undervalued, even when its growth outlook is factored into its intrinsic value? The intrinsic value infographic in our free research report helps visualize whether Rogers is currently mispriced by the market.
Other High-Growth Alternatives : Are there other high-growth stocks you could be holding instead of Rogers? Explore our interactive list of stocks with large growth potential to get an idea of what else is out there you may be missing!
To help readers see past the short term volatility of the financial market, we aim to bring you a long-term focused research analysis purely driven by fundamental data. Note that our analysis does not factor in the latest price-sensitive company announcements.
The author is an independent contributor and at the time of publication had no position in the stocks mentioned. For errors that warrant correction please contact the editor at editorial-team@simplywallst.com.

