
 Yahoo Movies
 How Did Lincoln National Corporation’s (NYSE:LNC) 13.08% ROE Fare Against The Industry?

This article is intended for those of you who are at the beginning of your investing journey and want to start learning about core concepts of fundamental analysis on practical examples from today’s market.
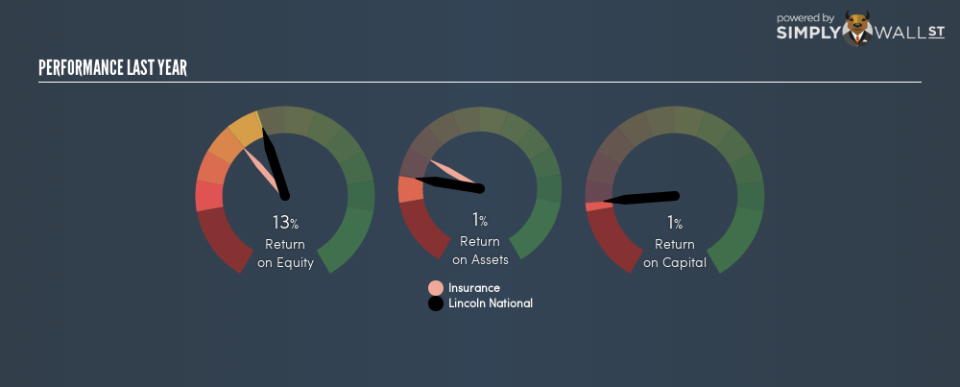
Lincoln National Corporation (NYSE:LNC) delivered an ROE of 13.08% over the past 12 months, which is an impressive feat relative to its industry average of 9.40% during the same period. While the impressive ratio tells us that LNC has made significant profits from little equity capital, ROE doesn’t tell us if LNC has borrowed debt to make this happen. We’ll take a closer look today at factors like financial leverage to determine whether LNC’s ROE is actually sustainable.
Check out our latest analysis for Lincoln National
Breaking down ROE — the mother of all ratios
Return on Equity (ROE) weighs Lincoln National’s profit against the level of its shareholders’ equity. An ROE of 13.08% implies $0.13 returned on every $1 invested. In most cases, a higher ROE is preferred; however, there are many other factors we must consider prior to making any investment decisions.
Return on Equity = Net Profit ÷ Shareholders Equity
ROE is measured against cost of equity in order to determine the efficiency of Lincoln National’s equity capital deployed. Its cost of equity is 9.32%. Since Lincoln National’s return covers its cost in excess of 3.76%, its use of equity capital is efficient and likely to be sustainable. Simply put, Lincoln National pays less for its capital than what it generates in return. ROE can be dissected into three distinct ratios: net profit margin, asset turnover, and financial leverage. This is called the Dupont Formula:
Dupont Formula
ROE = profit margin × asset turnover × financial leverage
ROE = (annual net profit ÷ sales) × (sales ÷ assets) × (assets ÷ shareholders’ equity)
ROE = annual net profit ÷ shareholders’ equity
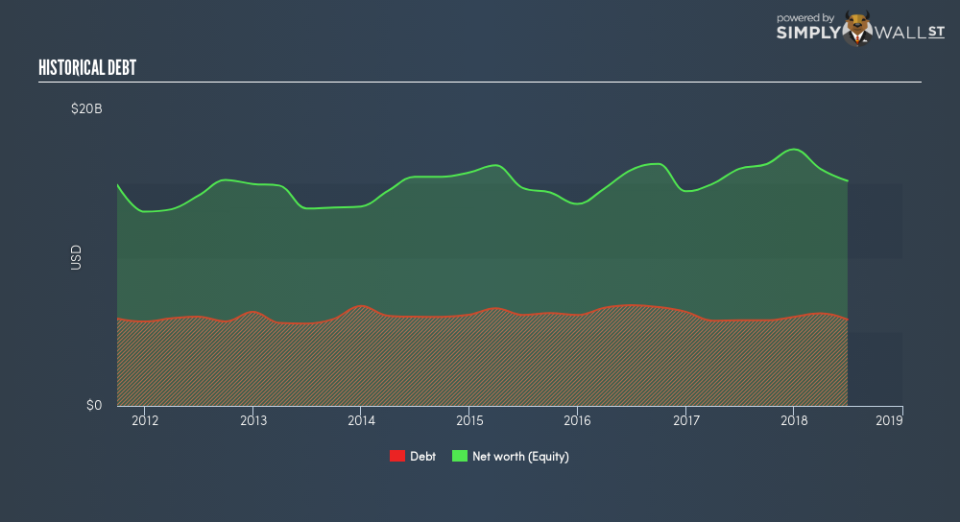
Essentially, profit margin shows how much money the company makes after paying for all its expenses. The other component, asset turnover, illustrates how much revenue Lincoln National can make from its asset base. And finally, financial leverage is simply how much of assets are funded by equity, which exhibits how sustainable the company’s capital structure is. Since ROE can be inflated by excessive debt, we need to examine Lincoln National’s debt-to-equity level. Currently the debt-to-equity ratio stands at a low 38.39%, which means its above-average ROE is driven by its ability to grow its profit without a significant debt burden.
Next Steps:
While ROE is a relatively simple calculation, it can be broken down into different ratios, each telling a different story about the strengths and weaknesses of a company. Lincoln National’s above-industry ROE is encouraging, and is also in excess of its cost of equity. ROE is not likely to be inflated by excessive debt funding, giving shareholders more conviction in the sustainability of high returns. Although ROE can be a useful metric, it is only a small part of diligent research.
For Lincoln National, I’ve put together three pertinent factors you should look at:
Financial Health: Does it have a healthy balance sheet? Take a look at our free balance sheet analysis with six simple checks on key factors like leverage and risk.
Valuation: What is Lincoln National worth today? Is the stock undervalued, even when its growth outlook is factored into its intrinsic value? The intrinsic value infographic in our free research report helps visualize whether Lincoln National is currently mispriced by the market.
Other High-Growth Alternatives : Are there other high-growth stocks you could be holding instead of Lincoln National? Explore our interactive list of stocks with large growth potential to get an idea of what else is out there you may be missing!
To help readers see past the short term volatility of the financial market, we aim to bring you a long-term focused research analysis purely driven by fundamental data. Note that our analysis does not factor in the latest price-sensitive company announcements.
The author is an independent contributor and at the time of publication had no position in the stocks mentioned. For errors that warrant correction please contact the editor at editorial-team@simplywallst.com.

