
 Yahoo Movies
 Despite Its High P/E Ratio, Is Penns Woods Bancorp, Inc. (NASDAQ:PWOD) Still Undervalued?

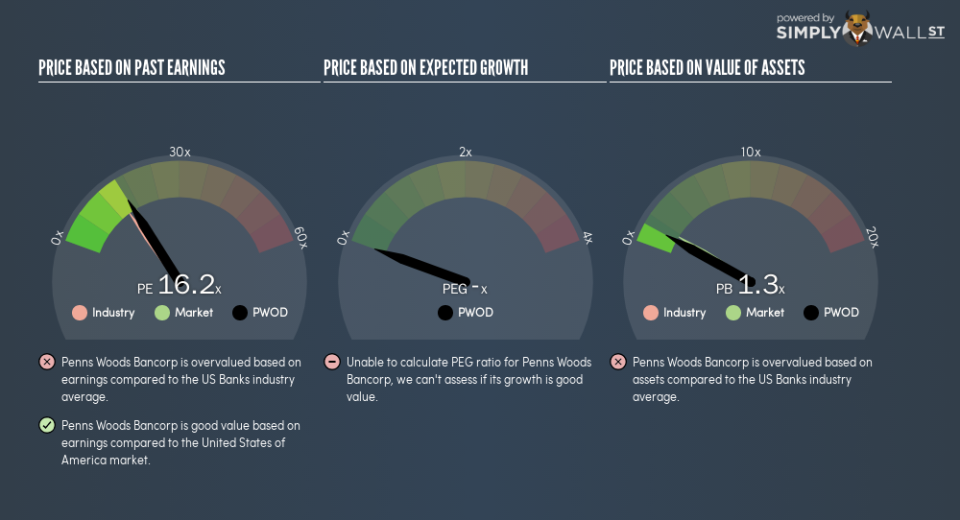
The goal of this article is to teach you how to use price to earnings ratios (P/E ratios). We’ll show how you can use Penns Woods Bancorp, Inc.’s (NASDAQ:PWOD) P/E ratio to inform your assessment of the investment opportunity. Penns Woods Bancorp has a price to earnings ratio of 16.21, based on the last twelve months. That means that at current prices, buyers pay $16.21 for every $1 in trailing yearly profits.
Check out our latest analysis for Penns Woods Bancorp
Want to help shape the future of investing tools and platforms? Take the survey and be part of one of the most advanced studies of stock market investors to date.
How Do I Calculate A Price To Earnings Ratio?
The formula for price to earnings is:
Price to Earnings Ratio = Price per Share ÷ Earnings per Share (EPS)
Or for Penns Woods Bancorp:
P/E of 16.21 = $38.82 ÷ $2.39 (Based on the year to September 2018.)
Is A High Price-to-Earnings Ratio Good?
A higher P/E ratio means that buyers have to pay a higher price for each $1 the company has earned over the last year. That isn’t a good or a bad thing on its own, but a high P/E means that buyers have a higher opinion of the business’s prospects, relative to stocks with a lower P/E.
How Growth Rates Impact P/E Ratios
Companies that shrink earnings per share quickly will rapidly decrease the ‘E’ in the equation. Therefore, even if you pay a low multiple of earnings now, that multiple will become higher in the future. A higher P/E should indicate the stock is expensive relative to others — and that may encourage shareholders to sell.
Penns Woods Bancorp shrunk earnings per share by 5.9% last year. And EPS is down 7.2% a year, over the last 5 years. So it would be surprising to see a high P/E.
How Does Penns Woods Bancorp’s P/E Ratio Compare To Its Peers?
The P/E ratio essentially measures market expectations of a company. You can see in the image below that the average P/E (14.6) for companies in the banks industry is lower than Penns Woods Bancorp’s P/E.
Penns Woods Bancorp’s P/E tells us that market participants think the company will perform better than its industry peers, going forward. Shareholders are clearly optimistic, but the future is always uncertain. So investors should delve deeper. I like to check if company insiders have been buying or selling.
Remember: P/E Ratios Don’t Consider The Balance Sheet
It’s important to note that the P/E ratio considers the market capitalization, not the enterprise value. That means it doesn’t take debt or cash into account. Hypothetically, a company could reduce its future P/E ratio by spending its cash (or taking on debt) to achieve higher earnings.
Spending on growth might be good or bad a few years later, but the point is that the P/E ratio does not account for the option (or lack thereof).
Penns Woods Bancorp’s Balance Sheet
Penns Woods Bancorp’s net debt is considerable, at 121% of its market cap. This is a relatively high level of debt, so the stock probably deserves a relatively low P/E ratio. Keep that in mind when comparing it to other companies.
The Verdict On Penns Woods Bancorp’s P/E Ratio
Penns Woods Bancorp has a P/E of 16.2. That’s around the same as the average in the US market, which is 16.8. With relatively high debt, and no earnings per share growth over twelve months, the P/E suggests that many have an expectation that company will find some growth.
When the market is wrong about a stock, it gives savvy investors an opportunity. As value investor Benjamin Graham famously said, ‘In the short run, the market is a voting machine but in the long run, it is a weighing machine.’ Although we don’t have analyst forecasts, shareholders might want to examine this detailed historical graph of earnings, revenue and cash flow.
You might be able to find a better buy than Penns Woods Bancorp. If you want a selection of possible winners, check out this free list of interesting companies that trade on a P/E below 20 (but have proven they can grow earnings).
To help readers see past the short term volatility of the financial market, we aim to bring you a long-term focused research analysis purely driven by fundamental data. Note that our analysis does not factor in the latest price-sensitive company announcements.
The author is an independent contributor and at the time of publication had no position in the stocks mentioned. For errors that warrant correction please contact the editor at editorial-team@simplywallst.com.

