
 Yahoo Movies
 Monash IVF Group Limited (ASX:MVF) Shares Could Be 45% Below Their Intrinsic Value Estimate
Today we'll do a simple run through of a valuation method used to estimate the attractiveness of Monash IVF Group Limited (ASX:MVF) as an investment opportunity by taking the forecast future cash flows of the company and discounting them back to today's value. Our analysis will employ the Discounted Cash Flow (DCF) model. Before you think you won't be able to understand it, just read on! It's actually much less complex than you'd imagine.
Companies can be valued in a lot of ways, so we would point out that a DCF is not perfect for every situation. Anyone interested in learning a bit more about intrinsic value should have a read of the Simply Wall St analysis model.
View our latest analysis for Monash IVF Group
What's the estimated valuation?
We're using the 2-stage growth model, which simply means we take in account two stages of company's growth. In the initial period the company may have a higher growth rate and the second stage is usually assumed to have a stable growth rate. To begin with, we have to get estimates of the next ten years of cash flows. Where possible we use analyst estimates, but when these aren't available we extrapolate the previous free cash flow (FCF) from the last estimate or reported value. We assume companies with shrinking free cash flow will slow their rate of shrinkage, and that companies with growing free cash flow will see their growth rate slow, over this period. We do this to reflect that growth tends to slow more in the early years than it does in later years.
Generally we assume that a dollar today is more valuable than a dollar in the future, so we need to discount the sum of these future cash flows to arrive at a present value estimate:
10-year free cash flow (FCF) estimate
2022 | 2023 | 2024 | 2025 | 2026 | 2027 | 2028 | 2029 | 2030 | 2031 | |
Levered FCF (A$, Millions) | AU$16.5m | AU$28.2m | AU$29.2m | AU$29.6m | AU$30.1m | AU$30.6m | AU$31.1m | AU$31.7m | AU$32.2m | AU$32.8m |
Growth Rate Estimate Source | Analyst x2 | Analyst x2 | Analyst x2 | Est @ 1.59% | Est @ 1.65% | Est @ 1.7% | Est @ 1.73% | Est @ 1.75% | Est @ 1.77% | Est @ 1.78% |
Present Value (A$, Millions) Discounted @ 5.4% | AU$15.7 | AU$25.4 | AU$24.9 | AU$24.0 | AU$23.2 | AU$22.4 | AU$21.6 | AU$20.8 | AU$20.1 | AU$19.4 |
("Est" = FCF growth rate estimated by Simply Wall St)
Present Value of 10-year Cash Flow (PVCF) = AU$217m
The second stage is also known as Terminal Value, this is the business's cash flow after the first stage. For a number of reasons a very conservative growth rate is used that cannot exceed that of a country's GDP growth. In this case we have used the 5-year average of the 10-year government bond yield (1.8%) to estimate future growth. In the same way as with the 10-year 'growth' period, we discount future cash flows to today's value, using a cost of equity of 5.4%.
Terminal Value (TV)= FCF2031 × (1 + g) ÷ (r – g) = AU$33m× (1 + 1.8%) ÷ (5.4%– 1.8%) = AU$935m
Present Value of Terminal Value (PVTV)= TV / (1 + r)10= AU$935m÷ ( 1 + 5.4%)10= AU$554m
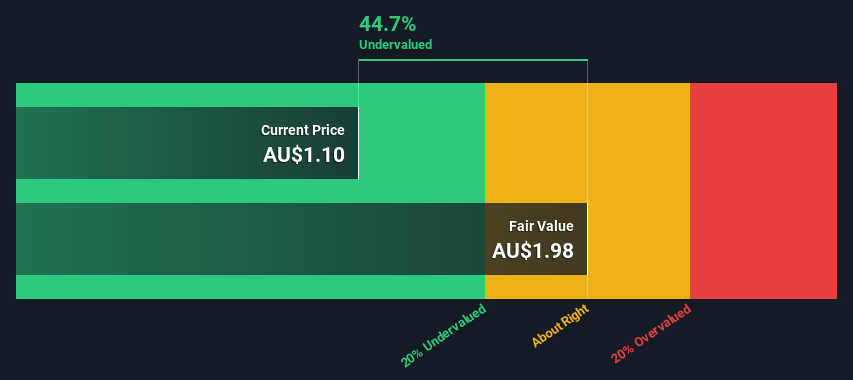
The total value, or equity value, is then the sum of the present value of the future cash flows, which in this case is AU$771m. To get the intrinsic value per share, we divide this by the total number of shares outstanding. Compared to the current share price of AU$1.1, the company appears quite good value at a 45% discount to where the stock price trades currently. Remember though, that this is just an approximate valuation, and like any complex formula - garbage in, garbage out.
The assumptions
We would point out that the most important inputs to a discounted cash flow are the discount rate and of course the actual cash flows. You don't have to agree with these inputs, I recommend redoing the calculations yourself and playing with them. The DCF also does not consider the possible cyclicality of an industry, or a company's future capital requirements, so it does not give a full picture of a company's potential performance. Given that we are looking at Monash IVF Group as potential shareholders, the cost of equity is used as the discount rate, rather than the cost of capital (or weighted average cost of capital, WACC) which accounts for debt. In this calculation we've used 5.4%, which is based on a levered beta of 0.843. Beta is a measure of a stock's volatility, compared to the market as a whole. We get our beta from the industry average beta of globally comparable companies, with an imposed limit between 0.8 and 2.0, which is a reasonable range for a stable business.
Moving On:
Valuation is only one side of the coin in terms of building your investment thesis, and it shouldn't be the only metric you look at when researching a company. The DCF model is not a perfect stock valuation tool. Instead the best use for a DCF model is to test certain assumptions and theories to see if they would lead to the company being undervalued or overvalued. If a company grows at a different rate, or if its cost of equity or risk free rate changes sharply, the output can look very different. Can we work out why the company is trading at a discount to intrinsic value? For Monash IVF Group, we've compiled three additional factors you should further examine:
Risks: We feel that you should assess the 1 warning sign for Monash IVF Group we've flagged before making an investment in the company.
Future Earnings: How does MVF's growth rate compare to its peers and the wider market? Dig deeper into the analyst consensus number for the upcoming years by interacting with our free analyst growth expectation chart.
Other High Quality Alternatives: Do you like a good all-rounder? Explore our interactive list of high quality stocks to get an idea of what else is out there you may be missing!
PS. Simply Wall St updates its DCF calculation for every Australian stock every day, so if you want to find the intrinsic value of any other stock just search here.
Have feedback on this article? Concerned about the content? Get in touch with us directly. Alternatively, email editorial-team (at) simplywallst.com.
This article by Simply Wall St is general in nature. We provide commentary based on historical data and analyst forecasts only using an unbiased methodology and our articles are not intended to be financial advice. It does not constitute a recommendation to buy or sell any stock, and does not take account of your objectives, or your financial situation. We aim to bring you long-term focused analysis driven by fundamental data. Note that our analysis may not factor in the latest price-sensitive company announcements or qualitative material. Simply Wall St has no position in any stocks mentioned.
