
 Yahoo Movies
 Is Mincon Group plc (LON:MCON) Popular Amongst Institutions?
The big shareholder groups in Mincon Group plc (LON:MCON) have power over the company. Insiders often own a large chunk of younger, smaller, companies while huge companies tend to have institutions as shareholders. Companies that have been privatized tend to have low insider ownership.
Mincon Group is a smaller company with a market capitalization of UK£219m, so it may still be flying under the radar of many institutional investors. Taking a look at our data on the ownership groups (below), it seems that institutional investors have bought into the company. Let's delve deeper into each type of owner, to discover more about Mincon Group.
Check out our latest analysis for Mincon Group
What Does The Institutional Ownership Tell Us About Mincon Group?
Institutional investors commonly compare their own returns to the returns of a commonly followed index. So they generally do consider buying larger companies that are included in the relevant benchmark index.
As you can see, institutional investors have a fair amount of stake in Mincon Group. This implies the analysts working for those institutions have looked at the stock and they like it. But just like anyone else, they could be wrong. If multiple institutions change their view on a stock at the same time, you could see the share price drop fast. It's therefore worth looking at Mincon Group's earnings history below. Of course, the future is what really matters.

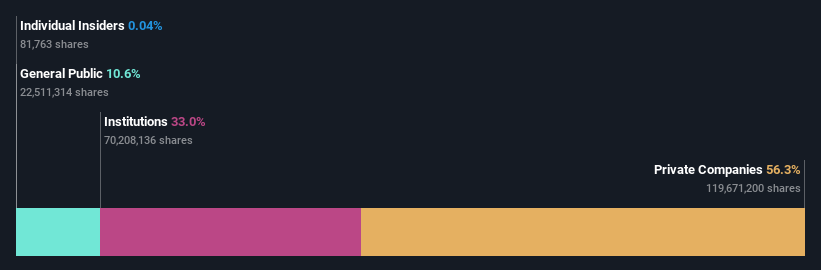
Hedge funds don't have many shares in Mincon Group. Kingbell Company is currently the company's largest shareholder with 56% of shares outstanding. With such a huge stake in the ownership, we infer that they have significant control of the future of the company. For context, the second largest shareholder holds about 12% of the shares outstanding, followed by an ownership of 9.4% by the third-largest shareholder.
While studying institutional ownership for a company can add value to your research, it is also a good practice to research analyst recommendations to get a deeper understand of a stock's expected performance. There is some analyst coverage of the stock, but it could still become more well known, with time.
Insider Ownership Of Mincon Group
While the precise definition of an insider can be subjective, almost everyone considers board members to be insiders. The company management answer to the board and the latter should represent the interests of shareholders. Notably, sometimes top-level managers are on the board themselves.
Most consider insider ownership a positive because it can indicate the board is well aligned with other shareholders. However, on some occasions too much power is concentrated within this group.
Our information suggests that Mincon Group plc insiders own under 1% of the company. However, it's possible that insiders might have an indirect interest through a more complex structure. It has a market capitalization of just UK£219m, and the board has only UK£84k worth of shares in their own names. We generally like to see a board more invested. However it might be worth checking if those insiders have been buying.
General Public Ownership
With a 11% ownership, the general public, mostly comprising of individual investors, have some degree of sway over Mincon Group. While this group can't necessarily call the shots, it can certainly have a real influence on how the company is run.
Private Company Ownership
Our data indicates that Private Companies hold 56%, of the company's shares. It might be worth looking deeper into this. If related parties, such as insiders, have an interest in one of these private companies, that should be disclosed in the annual report. Private companies may also have a strategic interest in the company.
Next Steps:
While it is well worth considering the different groups that own a company, there are other factors that are even more important.
I always like to check for a history of revenue growth. You can too, by accessing this free chart of historic revenue and earnings in this detailed graph.
Ultimately the future is most important. You can access this free report on analyst forecasts for the company.
NB: Figures in this article are calculated using data from the last twelve months, which refer to the 12-month period ending on the last date of the month the financial statement is dated. This may not be consistent with full year annual report figures.
Have feedback on this article? Concerned about the content? Get in touch with us directly. Alternatively, email editorial-team (at) simplywallst.com.
This article by Simply Wall St is general in nature. We provide commentary based on historical data and analyst forecasts only using an unbiased methodology and our articles are not intended to be financial advice. It does not constitute a recommendation to buy or sell any stock, and does not take account of your objectives, or your financial situation. We aim to bring you long-term focused analysis driven by fundamental data. Note that our analysis may not factor in the latest price-sensitive company announcements or qualitative material. Simply Wall St has no position in any stocks mentioned.

