
 Yahoo Movies
 Meta Bright Group Berhad (KLSE:MBRIGHT) Is Going Strong But Fundamentals Appear To Be Mixed : Is There A Clear Direction For The Stock?
Meta Bright Group Berhad (KLSE:MBRIGHT) has had a great run on the share market with its stock up by a significant 50% over the last three months. However, we wonder if the company's inconsistent financials would have any adverse impact on the current share price momentum. Particularly, we will be paying attention to Meta Bright Group Berhad's ROE today.
ROE or return on equity is a useful tool to assess how effectively a company can generate returns on the investment it received from its shareholders. Put another way, it reveals the company's success at turning shareholder investments into profits.
Check out our latest analysis for Meta Bright Group Berhad
How Do You Calculate Return On Equity?
The formula for ROE is:
Return on Equity = Net Profit (from continuing operations) ÷ Shareholders' Equity
So, based on the above formula, the ROE for Meta Bright Group Berhad is:
3.8% = RM7.2m ÷ RM187m (Based on the trailing twelve months to September 2022).
The 'return' is the profit over the last twelve months. That means that for every MYR1 worth of shareholders' equity, the company generated MYR0.04 in profit.
What Has ROE Got To Do With Earnings Growth?
We have already established that ROE serves as an efficient profit-generating gauge for a company's future earnings. We now need to evaluate how much profit the company reinvests or "retains" for future growth which then gives us an idea about the growth potential of the company. Assuming everything else remains unchanged, the higher the ROE and profit retention, the higher the growth rate of a company compared to companies that don't necessarily bear these characteristics.
A Side By Side comparison of Meta Bright Group Berhad's Earnings Growth And 3.8% ROE
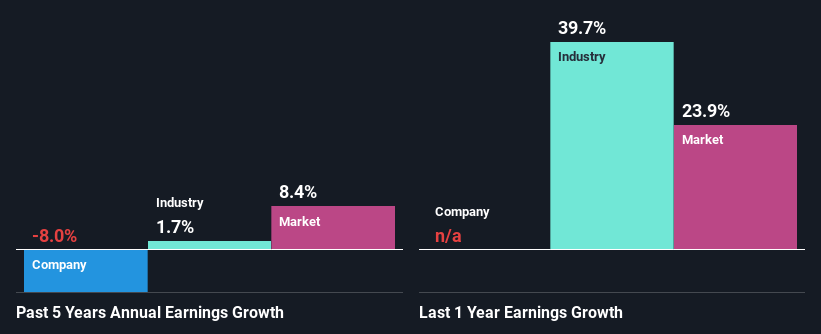
It is hard to argue that Meta Bright Group Berhad's ROE is much good in and of itself. An industry comparison shows that the company's ROE is not much different from the industry average of 3.7% either. Given the circumstances, the significant decline in net income by 8.0% seen by Meta Bright Group Berhad over the last five years is not surprising.
That being said, we compared Meta Bright Group Berhad's performance with the industry and were concerned when we found that while the company has shrunk its earnings, the industry has grown its earnings at a rate of 1.7% in the same period.
The basis for attaching value to a company is, to a great extent, tied to its earnings growth. The investor should try to establish if the expected growth or decline in earnings, whichever the case may be, is priced in. Doing so will help them establish if the stock's future looks promising or ominous. One good indicator of expected earnings growth is the P/E ratio which determines the price the market is willing to pay for a stock based on its earnings prospects. So, you may want to check if Meta Bright Group Berhad is trading on a high P/E or a low P/E, relative to its industry.
Is Meta Bright Group Berhad Efficiently Re-investing Its Profits?
Because Meta Bright Group Berhad doesn't pay any dividends, we infer that it is retaining all of its profits, which is rather perplexing when you consider the fact that there is no earnings growth to show for it. So there could be some other explanations in that regard. For instance, the company's business may be deteriorating.
Conclusion
In total, we're a bit ambivalent about Meta Bright Group Berhad's performance. While the company does have a high rate of profit retention, its low rate of return is probably hampering its earnings growth. Wrapping up, we would proceed with caution with this company and one way of doing that would be to look at the risk profile of the business. Our risks dashboard would have the 3 risks we have identified for Meta Bright Group Berhad.
Have feedback on this article? Concerned about the content? Get in touch with us directly. Alternatively, email editorial-team (at) simplywallst.com.
This article by Simply Wall St is general in nature. We provide commentary based on historical data and analyst forecasts only using an unbiased methodology and our articles are not intended to be financial advice. It does not constitute a recommendation to buy or sell any stock, and does not take account of your objectives, or your financial situation. We aim to bring you long-term focused analysis driven by fundamental data. Note that our analysis may not factor in the latest price-sensitive company announcements or qualitative material. Simply Wall St has no position in any stocks mentioned.
Join A Paid User Research Session
You’ll receive a US$30 Amazon Gift card for 1 hour of your time while helping us build better investing tools for the individual investors like yourself. Sign up here
