
 Yahoo Movies
 A Look At The Intrinsic Value Of REDtone Digital Berhad (KLSE:REDTONE)
How far off is REDtone Digital Berhad (KLSE:REDTONE) from its intrinsic value? Using the most recent financial data, we'll take a look at whether the stock is fairly priced by estimating the company's future cash flows and discounting them to their present value. One way to achieve this is by employing the Discounted Cash Flow (DCF) model. Believe it or not, it's not too difficult to follow, as you'll see from our example!
We would caution that there are many ways of valuing a company and, like the DCF, each technique has advantages and disadvantages in certain scenarios. For those who are keen learners of equity analysis, the Simply Wall St analysis model here may be something of interest to you.
Check out our latest analysis for REDtone Digital Berhad
The Model
We use what is known as a 2-stage model, which simply means we have two different periods of growth rates for the company's cash flows. Generally the first stage is higher growth, and the second stage is a lower growth phase. To start off with, we need to estimate the next ten years of cash flows. Seeing as no analyst estimates of free cash flow are available to us, we have extrapolate the previous free cash flow (FCF) from the company's last reported value. We assume companies with shrinking free cash flow will slow their rate of shrinkage, and that companies with growing free cash flow will see their growth rate slow, over this period. We do this to reflect that growth tends to slow more in the early years than it does in later years.
A DCF is all about the idea that a dollar in the future is less valuable than a dollar today, and so the sum of these future cash flows is then discounted to today's value:
10-year free cash flow (FCF) estimate
2023 | 2024 | 2025 | 2026 | 2027 | 2028 | 2029 | 2030 | 2031 | 2032 | |
Levered FCF (MYR, Millions) | RM39.6m | RM36.9m | RM35.5m | RM35.0m | RM35.0m | RM35.4m | RM36.0m | RM36.8m | RM37.8m | RM38.9m |
Growth Rate Estimate Source | Est @ -11.26% | Est @ -6.82% | Est @ -3.71% | Est @ -1.53% | Est @ -0.01% | Est @ 1.06% | Est @ 1.81% | Est @ 2.33% | Est @ 2.70% | Est @ 2.95% |
Present Value (MYR, Millions) Discounted @ 9.7% | RM36.1 | RM30.7 | RM26.9 | RM24.2 | RM22.0 | RM20.3 | RM18.8 | RM17.6 | RM16.4 | RM15.4 |
("Est" = FCF growth rate estimated by Simply Wall St)
Present Value of 10-year Cash Flow (PVCF) = RM228m
After calculating the present value of future cash flows in the initial 10-year period, we need to calculate the Terminal Value, which accounts for all future cash flows beyond the first stage. For a number of reasons a very conservative growth rate is used that cannot exceed that of a country's GDP growth. In this case we have used the 5-year average of the 10-year government bond yield (3.6%) to estimate future growth. In the same way as with the 10-year 'growth' period, we discount future cash flows to today's value, using a cost of equity of 9.7%.
Terminal Value (TV)= FCF2032 × (1 + g) ÷ (r – g) = RM39m× (1 + 3.6%) ÷ (9.7%– 3.6%) = RM656m
Present Value of Terminal Value (PVTV)= TV / (1 + r)10= RM656m÷ ( 1 + 9.7%)10= RM260m
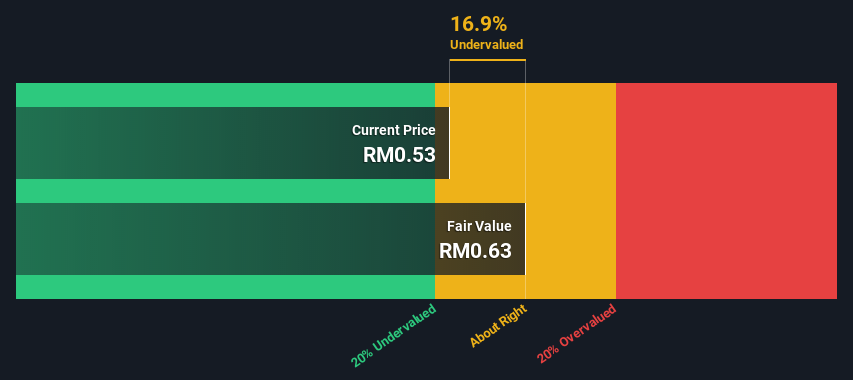
The total value is the sum of cash flows for the next ten years plus the discounted terminal value, which results in the Total Equity Value, which in this case is RM488m. To get the intrinsic value per share, we divide this by the total number of shares outstanding. Relative to the current share price of RM0.5, the company appears about fair value at a 17% discount to where the stock price trades currently. Remember though, that this is just an approximate valuation, and like any complex formula - garbage in, garbage out.
Important Assumptions
Now the most important inputs to a discounted cash flow are the discount rate, and of course, the actual cash flows. You don't have to agree with these inputs, I recommend redoing the calculations yourself and playing with them. The DCF also does not consider the possible cyclicality of an industry, or a company's future capital requirements, so it does not give a full picture of a company's potential performance. Given that we are looking at REDtone Digital Berhad as potential shareholders, the cost of equity is used as the discount rate, rather than the cost of capital (or weighted average cost of capital, WACC) which accounts for debt. In this calculation we've used 9.7%, which is based on a levered beta of 0.800. Beta is a measure of a stock's volatility, compared to the market as a whole. We get our beta from the industry average beta of globally comparable companies, with an imposed limit between 0.8 and 2.0, which is a reasonable range for a stable business.
SWOT Analysis for REDtone Digital Berhad
Strength
Earnings growth over the past year exceeded the industry.
Debt is not viewed as a risk.
Dividends are covered by earnings and cash flows.
Weakness
Dividend is low compared to the top 25% of dividend payers in the Telecom market.
Opportunity
Current share price is below our estimate of fair value.
Lack of analyst coverage makes it difficult to determine REDTONE's earnings prospects.
Threat
No apparent threats visible for REDTONE.
Moving On:
Whilst important, the DCF calculation shouldn't be the only metric you look at when researching a company. The DCF model is not a perfect stock valuation tool. Rather it should be seen as a guide to "what assumptions need to be true for this stock to be under/overvalued?" For example, changes in the company's cost of equity or the risk free rate can significantly impact the valuation. For REDtone Digital Berhad, we've compiled three important elements you should further research:
Risks: For instance, we've identified 2 warning signs for REDtone Digital Berhad that you should be aware of.
Other High Quality Alternatives: Do you like a good all-rounder? Explore our interactive list of high quality stocks to get an idea of what else is out there you may be missing!
Other Environmentally-Friendly Companies: Concerned about the environment and think consumers will buy eco-friendly products more and more? Browse through our interactive list of companies that are thinking about a greener future to discover some stocks you may not have thought of!
PS. Simply Wall St updates its DCF calculation for every Malaysian stock every day, so if you want to find the intrinsic value of any other stock just search here.
Have feedback on this article? Concerned about the content? Get in touch with us directly. Alternatively, email editorial-team (at) simplywallst.com.
This article by Simply Wall St is general in nature. We provide commentary based on historical data and analyst forecasts only using an unbiased methodology and our articles are not intended to be financial advice. It does not constitute a recommendation to buy or sell any stock, and does not take account of your objectives, or your financial situation. We aim to bring you long-term focused analysis driven by fundamental data. Note that our analysis may not factor in the latest price-sensitive company announcements or qualitative material. Simply Wall St has no position in any stocks mentioned.
Join A Paid User Research Session
You’ll receive a US$30 Amazon Gift card for 1 hour of your time while helping us build better investing tools for the individual investors like yourself. Sign up here

