
 Yahoo Movies
 A Look At The Fair Value Of Magni-Tech Industries Berhad (KLSE:MAGNI)
Today we'll do a simple run through of a valuation method used to estimate the attractiveness of Magni-Tech Industries Berhad (KLSE:MAGNI) as an investment opportunity by estimating the company's future cash flows and discounting them to their present value. The Discounted Cash Flow (DCF) model is the tool we will apply to do this. Believe it or not, it's not too difficult to follow, as you'll see from our example!
Companies can be valued in a lot of ways, so we would point out that a DCF is not perfect for every situation. Anyone interested in learning a bit more about intrinsic value should have a read of the Simply Wall St analysis model.
Check out our latest analysis for Magni-Tech Industries Berhad
Step By Step Through The Calculation
We are going to use a two-stage DCF model, which, as the name states, takes into account two stages of growth. The first stage is generally a higher growth period which levels off heading towards the terminal value, captured in the second 'steady growth' period. In the first stage we need to estimate the cash flows to the business over the next ten years. Seeing as no analyst estimates of free cash flow are available to us, we have extrapolate the previous free cash flow (FCF) from the company's last reported value. We assume companies with shrinking free cash flow will slow their rate of shrinkage, and that companies with growing free cash flow will see their growth rate slow, over this period. We do this to reflect that growth tends to slow more in the early years than it does in later years.
Generally we assume that a dollar today is more valuable than a dollar in the future, so we need to discount the sum of these future cash flows to arrive at a present value estimate:
10-year free cash flow (FCF) forecast
2023 | 2024 | 2025 | 2026 | 2027 | 2028 | 2029 | 2030 | 2031 | 2032 | |
Levered FCF (MYR, Millions) | RM80.4m | RM78.3m | RM77.7m | RM78.1m | RM79.2m | RM80.8m | RM82.9m | RM85.2m | RM87.8m | RM90.6m |
Growth Rate Estimate Source | Est @ -5.31% | Est @ -2.64% | Est @ -0.78% | Est @ 0.53% | Est @ 1.44% | Est @ 2.08% | Est @ 2.53% | Est @ 2.84% | Est @ 3.06% | Est @ 3.21% |
Present Value (MYR, Millions) Discounted @ 12% | RM71.7 | RM62.3 | RM55.1 | RM49.4 | RM44.7 | RM40.7 | RM37.2 | RM34.2 | RM31.4 | RM28.9 |
("Est" = FCF growth rate estimated by Simply Wall St)
Present Value of 10-year Cash Flow (PVCF) = RM456m
After calculating the present value of future cash flows in the initial 10-year period, we need to calculate the Terminal Value, which accounts for all future cash flows beyond the first stage. The Gordon Growth formula is used to calculate Terminal Value at a future annual growth rate equal to the 5-year average of the 10-year government bond yield of 3.6%. We discount the terminal cash flows to today's value at a cost of equity of 12%.
Terminal Value (TV)= FCF2032 × (1 + g) ÷ (r – g) = RM91m× (1 + 3.6%) ÷ (12%– 3.6%) = RM1.1b
Present Value of Terminal Value (PVTV)= TV / (1 + r)10= RM1.1b÷ ( 1 + 12%)10= RM351m
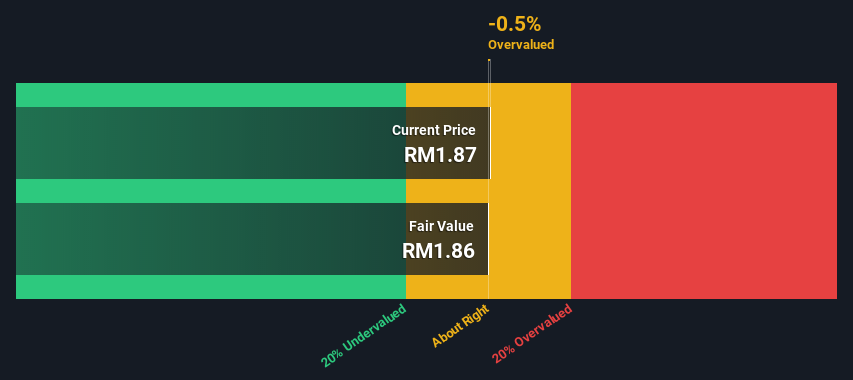
The total value, or equity value, is then the sum of the present value of the future cash flows, which in this case is RM806m. To get the intrinsic value per share, we divide this by the total number of shares outstanding. Relative to the current share price of RM1.9, the company appears around fair value at the time of writing. Valuations are imprecise instruments though, rather like a telescope - move a few degrees and end up in a different galaxy. Do keep this in mind.
Important Assumptions
We would point out that the most important inputs to a discounted cash flow are the discount rate and of course the actual cash flows. You don't have to agree with these inputs, I recommend redoing the calculations yourself and playing with them. The DCF also does not consider the possible cyclicality of an industry, or a company's future capital requirements, so it does not give a full picture of a company's potential performance. Given that we are looking at Magni-Tech Industries Berhad as potential shareholders, the cost of equity is used as the discount rate, rather than the cost of capital (or weighted average cost of capital, WACC) which accounts for debt. In this calculation we've used 12%, which is based on a levered beta of 1.066. Beta is a measure of a stock's volatility, compared to the market as a whole. We get our beta from the industry average beta of globally comparable companies, with an imposed limit between 0.8 and 2.0, which is a reasonable range for a stable business.
SWOT Analysis for Magni-Tech Industries Berhad
Strength
Currently debt free.
Dividends are covered by earnings and cash flows.
Dividend is in the top 25% of dividend payers in the market.
Weakness
Earnings declined over the past year.
Opportunity
Annual revenue is forecast to grow faster than the Malaysian market.
Good value based on P/E ratio compared to estimated Fair P/E ratio.
Threat
No apparent threats visible for MAGNI.
Next Steps:
Valuation is only one side of the coin in terms of building your investment thesis, and it is only one of many factors that you need to assess for a company. The DCF model is not a perfect stock valuation tool. Rather it should be seen as a guide to "what assumptions need to be true for this stock to be under/overvalued?" For example, changes in the company's cost of equity or the risk free rate can significantly impact the valuation. For Magni-Tech Industries Berhad, we've compiled three additional aspects you should look at:
Risks: As an example, we've found 1 warning sign for Magni-Tech Industries Berhad that you need to consider before investing here.
Future Earnings: How does MAGNI's growth rate compare to its peers and the wider market? Dig deeper into the analyst consensus number for the upcoming years by interacting with our free analyst growth expectation chart.
Other High Quality Alternatives: Do you like a good all-rounder? Explore our interactive list of high quality stocks to get an idea of what else is out there you may be missing!
PS. Simply Wall St updates its DCF calculation for every Malaysian stock every day, so if you want to find the intrinsic value of any other stock just search here.
Have feedback on this article? Concerned about the content? Get in touch with us directly. Alternatively, email editorial-team (at) simplywallst.com.
This article by Simply Wall St is general in nature. We provide commentary based on historical data and analyst forecasts only using an unbiased methodology and our articles are not intended to be financial advice. It does not constitute a recommendation to buy or sell any stock, and does not take account of your objectives, or your financial situation. We aim to bring you long-term focused analysis driven by fundamental data. Note that our analysis may not factor in the latest price-sensitive company announcements or qualitative material. Simply Wall St has no position in any stocks mentioned.
Join A Paid User Research Session
You’ll receive a US$30 Amazon Gift card for 1 hour of your time while helping us build better investing tools for the individual investors like yourself. Sign up here

