
 Yahoo Movies
 London rents: the share of income it takes to rent a home — in every borough
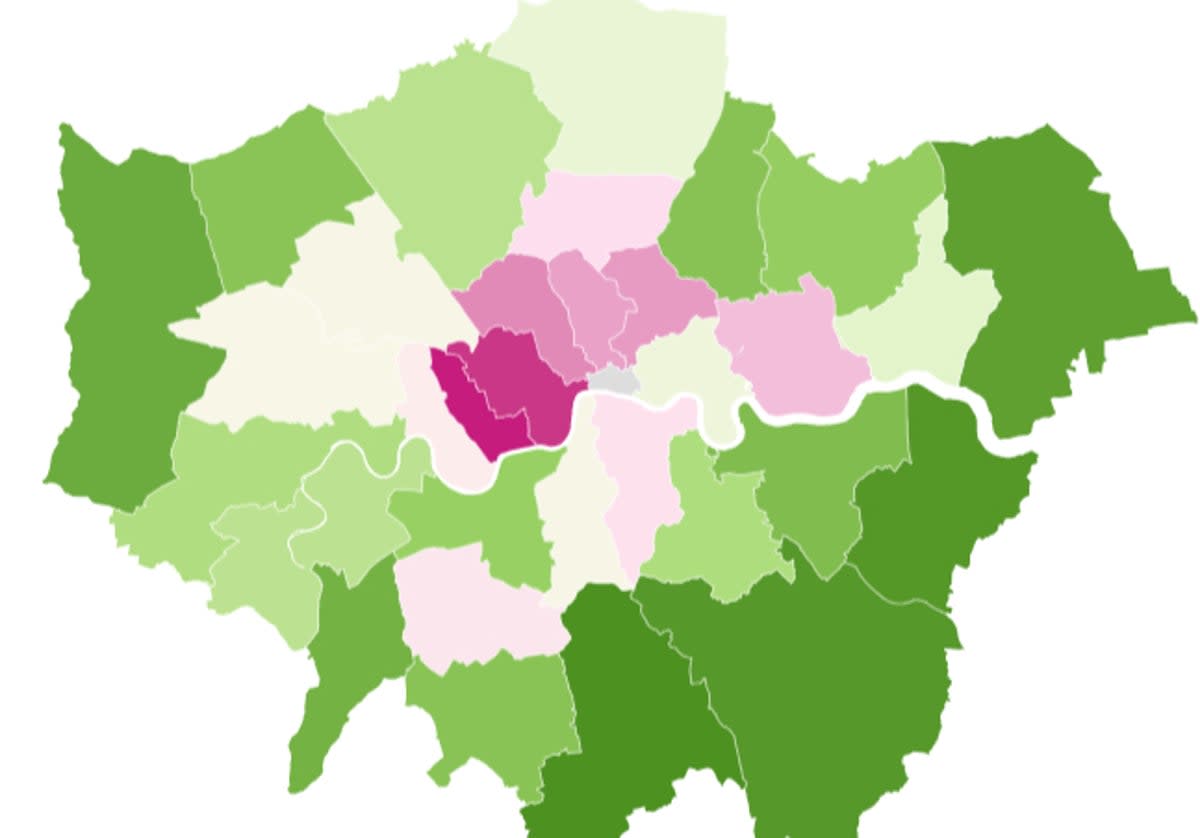
London tenants now spend more than half their wages on rent, according to new analysis of official figures.
Across the capital, renters part with 53.6 per cent of their income to cover housing costs — with the share of income rising to above 80 per cent in London’s most expensive boroughs.
The research, by property insurance specialists Alan Boswell, is based on median salaries and rental costs for a two-bedroom home in areas across Britain.
According to the data, the monthly London income is £2,798 — higher than in any other region — yet the median rental cost is more than half of that at £1,500 per month.
Global affordability standards suggest that housing costs should be no more than 30 per cent of your take-home pay, while expenditure should be divided according to the 50/30/20 rule, whereby net income is split into 50 per cent for needs (housing, bills, food and transport), 30 per cent for wants (holidays and discretionary spending) and 20 per cent for savings or paying off debt.
The most expensive borough to live and work in, according to the analysis, is Kensington & Chelsea. With a median monthly income of £3,088 and monthly rental costs of £2,695, tenants would have to spend about 87.3 per cent of their income on rent.
Conversely, Croydon is the most affordable borough. Median monthly incomes are £2,893 while rents are £1,250, meaning tenants would spend 43.2 per cent of their income on rent.
Five least affordable boroughs for private tenants
London borough | Median monthly income | Median monthly rent (two-bed home) | Proportion of income spent on rent |
Kensington and Chelsea | £3,088 | £2,695 | 87.3% |
Westminster | £3,198 | £2,687 | 84.5% |
Camden | £2,991 | £2,050 | 68.6% |
Hackney | £2,704 | £1,750 | 64.7% |
Islington | £3,037 | £1,925 | 63.4% |
Source: Alan Boswell & ONS
Local estate agent Cray & Norton describes Croydon as a “vibrant town” that’s home to a raft of big companies. The area’s three train stations link to central London and Brighton, and it has its own tram network and a range of properties from town-centre studios to detached homes on private roads.
The other London boroughs in the top five “cheapest” are Bexley, Bromley, Havering and Hillingdon.
Five most affordable boroughs for private tenants
London borough | Median monthly income | Median monthly rent (two-bed home) | Proportion of income spent on rent |
Croydon | £2,893 | £1,250 | 43.2% |
Bexley | £2,780 | £1,225 | 44.1% |
Bromley | £3,054 | £1,350 | 44.2% |
Havering | £2,658 | £1,200 | 45.2% |
Hillingdon | £2,728 | £1,275 | 46.7% |
Source: Alan Boswell & ONS
Surprisingly the research also found that Newham — consistently among London’s cheapest areas to buy a home — is less affordable for typical renters than Hammersmith and Fulham, while Wandsworth tenants spend less of the median income on rent than those in Tower Hamlets.
Outside London, tenants spend the smallest percentage of their income on rent in the North-East (23.5 per cent), Wales (27.2 per cent), Yorkshire and the Humber (27.7 per cent), the North-West (27.9 per cent) and East Midlands (29.7 per cent).
At the other end of the scale, in the South-East — where there are high numbers of towns and villages within commuting distance of London — 40.4 per cent of income is spent on rental costs.
A spokesperson for campaign body London Renters Union said: “London renters are at breaking point. It is unfair that a growing number of people are trapped in an extortionate rental market, forced to forfeit a massive proportion of their income for a housing system that gives them nothing long-term in return.”
Heath Alexander-Bew, director of personal lines at Alan Boswell, said: “While Londoners in high-rent areas likely have higher salaries or additional compensation to help them live on what’s left of that income, others may have to make compromises between location and price more frequently than before.”

