
 Yahoo Movies
 Is Lalique Group SA's (VTX:LLQ) Recent Price Movement Underpinned By Its Weak Fundamentals?
It is hard to get excited after looking at Lalique Group's (VTX:LLQ) recent performance, when its stock has declined 9.1% over the past three months. It seems that the market might have completely ignored the positive aspects of the company's fundamentals and decided to weigh-in more on the negative aspects. Stock prices are usually driven by a company’s financial performance over the long term, and therefore we decided to pay more attention to the company's financial performance. Specifically, we decided to study Lalique Group's ROE in this article.
Return on equity or ROE is an important factor to be considered by a shareholder because it tells them how effectively their capital is being reinvested. In other words, it is a profitability ratio which measures the rate of return on the capital provided by the company's shareholders.
Check out our latest analysis for Lalique Group
How Is ROE Calculated?
The formula for ROE is:
Return on Equity = Net Profit (from continuing operations) ÷ Shareholders' Equity
So, based on the above formula, the ROE for Lalique Group is:
4.3% = €8.3m ÷ €194m (Based on the trailing twelve months to June 2022).
The 'return' is the profit over the last twelve months. One way to conceptualize this is that for each CHF1 of shareholders' capital it has, the company made CHF0.04 in profit.
What Is The Relationship Between ROE And Earnings Growth?
Thus far, we have learned that ROE measures how efficiently a company is generating its profits. Depending on how much of these profits the company reinvests or "retains", and how effectively it does so, we are then able to assess a company’s earnings growth potential. Assuming everything else remains unchanged, the higher the ROE and profit retention, the higher the growth rate of a company compared to companies that don't necessarily bear these characteristics.
Lalique Group's Earnings Growth And 4.3% ROE
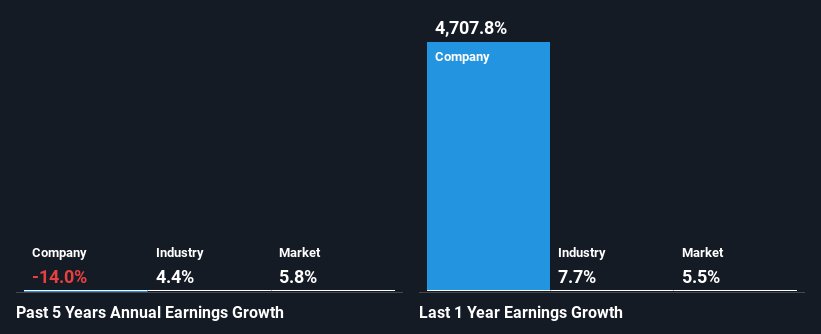
On the face of it, Lalique Group's ROE is not much to talk about. Next, when compared to the average industry ROE of 12%, the company's ROE leaves us feeling even less enthusiastic. For this reason, Lalique Group's five year net income decline of 14% is not surprising given its lower ROE. We reckon that there could also be other factors at play here. For example, it is possible that the business has allocated capital poorly or that the company has a very high payout ratio.
So, as a next step, we compared Lalique Group's performance against the industry and were disappointed to discover that while the company has been shrinking its earnings, the industry has been growing its earnings at a rate of 8.5% in the same period.
Earnings growth is an important metric to consider when valuing a stock. What investors need to determine next is if the expected earnings growth, or the lack of it, is already built into the share price. This then helps them determine if the stock is placed for a bright or bleak future. Has the market priced in the future outlook for LLQ? You can find out in our latest intrinsic value infographic research report
Is Lalique Group Efficiently Re-investing Its Profits?
In spite of a normal three-year median payout ratio of 34% (that is, a retention ratio of 66%), the fact that Lalique Group's earnings have shrunk is quite puzzling. It looks like there might be some other reasons to explain the lack in that respect. For example, the business could be in decline.
In addition, Lalique Group has been paying dividends over a period of seven years suggesting that keeping up dividend payments is preferred by the management even though earnings have been in decline.
Summary
In total, we're a bit ambivalent about Lalique Group's performance. While the company does have a high rate of profit retention, its low rate of return is probably hampering its earnings growth. Having said that, looking at current analyst estimates, we found that the company's earnings growth rate is expected to see a huge improvement. To know more about the company's future earnings growth forecasts take a look at this free report on analyst forecasts for the company to find out more.
Have feedback on this article? Concerned about the content? Get in touch with us directly. Alternatively, email editorial-team (at) simplywallst.com.
This article by Simply Wall St is general in nature. We provide commentary based on historical data and analyst forecasts only using an unbiased methodology and our articles are not intended to be financial advice. It does not constitute a recommendation to buy or sell any stock, and does not take account of your objectives, or your financial situation. We aim to bring you long-term focused analysis driven by fundamental data. Note that our analysis may not factor in the latest price-sensitive company announcements or qualitative material. Simply Wall St has no position in any stocks mentioned.
Join A Paid User Research Session
You’ll receive a US$30 Amazon Gift card for 1 hour of your time while helping us build better investing tools for the individual investors like yourself. Sign up here

