
 Yahoo Movies
 Are Investors Undervaluing ADT Inc. (NYSE:ADT) By 40%?
How far off is ADT Inc. (NYSE:ADT) from its intrinsic value? Using the most recent financial data, we'll take a look at whether the stock is fairly priced by taking the expected future cash flows and discounting them to today's value. We will use the Discounted Cash Flow (DCF) model on this occasion. Believe it or not, it's not too difficult to follow, as you'll see from our example!
Companies can be valued in a lot of ways, so we would point out that a DCF is not perfect for every situation. Anyone interested in learning a bit more about intrinsic value should have a read of the Simply Wall St analysis model.
Check out our latest analysis for ADT
Step By Step Through The Calculation
We use what is known as a 2-stage model, which simply means we have two different periods of growth rates for the company's cash flows. Generally the first stage is higher growth, and the second stage is a lower growth phase. In the first stage we need to estimate the cash flows to the business over the next ten years. Where possible we use analyst estimates, but when these aren't available we extrapolate the previous free cash flow (FCF) from the last estimate or reported value. We assume companies with shrinking free cash flow will slow their rate of shrinkage, and that companies with growing free cash flow will see their growth rate slow, over this period. We do this to reflect that growth tends to slow more in the early years than it does in later years.
A DCF is all about the idea that a dollar in the future is less valuable than a dollar today, so we discount the value of these future cash flows to their estimated value in today's dollars:
10-year free cash flow (FCF) estimate
2023 | 2024 | 2025 | 2026 | 2027 | 2028 | 2029 | 2030 | 2031 | 2032 | |
Levered FCF ($, Millions) | US$654.7m | US$799.6m | US$906.7m | US$997.2m | US$1.07b | US$1.14b | US$1.19b | US$1.24b | US$1.28b | US$1.31b |
Growth Rate Estimate Source | Analyst x2 | Analyst x1 | Est @ 13.40% | Est @ 9.97% | Est @ 7.58% | Est @ 5.90% | Est @ 4.72% | Est @ 3.90% | Est @ 3.32% | Est @ 2.92% |
Present Value ($, Millions) Discounted @ 9.6% | US$597 | US$665 | US$688 | US$690 | US$677 | US$654 | US$625 | US$592 | US$558 | US$524 |
("Est" = FCF growth rate estimated by Simply Wall St)
Present Value of 10-year Cash Flow (PVCF) = US$6.3b
We now need to calculate the Terminal Value, which accounts for all the future cash flows after this ten year period. The Gordon Growth formula is used to calculate Terminal Value at a future annual growth rate equal to the 5-year average of the 10-year government bond yield of 2.0%. We discount the terminal cash flows to today's value at a cost of equity of 9.6%.
Terminal Value (TV)= FCF2032 × (1 + g) ÷ (r – g) = US$1.3b× (1 + 2.0%) ÷ (9.6%– 2.0%) = US$18b
Present Value of Terminal Value (PVTV)= TV / (1 + r)10= US$18b÷ ( 1 + 9.6%)10= US$7.0b
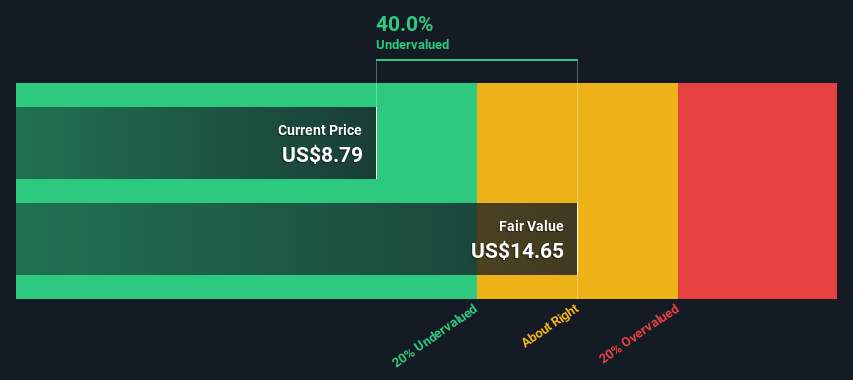
The total value, or equity value, is then the sum of the present value of the future cash flows, which in this case is US$13b. In the final step we divide the equity value by the number of shares outstanding. Relative to the current share price of US$8.8, the company appears quite undervalued at a 40% discount to where the stock price trades currently. Remember though, that this is just an approximate valuation, and like any complex formula - garbage in, garbage out.
Important Assumptions
Now the most important inputs to a discounted cash flow are the discount rate, and of course, the actual cash flows. You don't have to agree with these inputs, I recommend redoing the calculations yourself and playing with them. The DCF also does not consider the possible cyclicality of an industry, or a company's future capital requirements, so it does not give a full picture of a company's potential performance. Given that we are looking at ADT as potential shareholders, the cost of equity is used as the discount rate, rather than the cost of capital (or weighted average cost of capital, WACC) which accounts for debt. In this calculation we've used 9.6%, which is based on a levered beta of 1.274. Beta is a measure of a stock's volatility, compared to the market as a whole. We get our beta from the industry average beta of globally comparable companies, with an imposed limit between 0.8 and 2.0, which is a reasonable range for a stable business.
SWOT Analysis for ADT
Strength
No major strengths identified for ADT.
Weakness
Interest payments on debt are not well covered.
Dividend is low compared to the top 25% of dividend payers in the Consumer Services market.
Shareholders have been diluted in the past year.
Opportunity
Expected to breakeven next year.
Has sufficient cash runway for more than 3 years based on current free cash flows.
Good value based on P/S ratio and estimated fair value.
Threat
Debt is not well covered by operating cash flow.
Paying a dividend but company is unprofitable.
Moving On:
Whilst important, the DCF calculation shouldn't be the only metric you look at when researching a company. The DCF model is not a perfect stock valuation tool. Preferably you'd apply different cases and assumptions and see how they would impact the company's valuation. For instance, if the terminal value growth rate is adjusted slightly, it can dramatically alter the overall result. Why is the intrinsic value higher than the current share price? For ADT, we've compiled three relevant items you should assess:
Risks: For instance, we've identified 3 warning signs for ADT that you should be aware of.
Management:Have insiders been ramping up their shares to take advantage of the market's sentiment for ADT's future outlook? Check out our management and board analysis with insights on CEO compensation and governance factors.
Other High Quality Alternatives: Do you like a good all-rounder? Explore our interactive list of high quality stocks to get an idea of what else is out there you may be missing!
PS. Simply Wall St updates its DCF calculation for every American stock every day, so if you want to find the intrinsic value of any other stock just search here.
Have feedback on this article? Concerned about the content? Get in touch with us directly. Alternatively, email editorial-team (at) simplywallst.com.
This article by Simply Wall St is general in nature. We provide commentary based on historical data and analyst forecasts only using an unbiased methodology and our articles are not intended to be financial advice. It does not constitute a recommendation to buy or sell any stock, and does not take account of your objectives, or your financial situation. We aim to bring you long-term focused analysis driven by fundamental data. Note that our analysis may not factor in the latest price-sensitive company announcements or qualitative material. Simply Wall St has no position in any stocks mentioned.
Join A Paid User Research Session
You’ll receive a US$30 Amazon Gift card for 1 hour of your time while helping us build better investing tools for the individual investors like yourself. Sign up here

