
 Yahoo Movies
 Investors in easyJet (LON:EZJ) from five years ago are still down 51%, even after 3.8% gain this past week
Generally speaking long term investing is the way to go. But along the way some stocks are going to perform badly. Zooming in on an example, the easyJet plc (LON:EZJ) share price dropped 63% in the last half decade. We certainly feel for shareholders who bought near the top. And some of the more recent buyers are probably worried, too, with the stock falling 47% in the last year. The falls have accelerated recently, with the share price down 23% in the last three months. We note that the company has reported results fairly recently; and the market is hardly delighted. You can check out the latest numbers in our company report.
While the last five years has been tough for easyJet shareholders, this past week has shown signs of promise. So let's look at the longer term fundamentals and see if they've been the driver of the negative returns.
Check out our latest analysis for easyJet
easyJet isn't currently profitable, so most analysts would look to revenue growth to get an idea of how fast the underlying business is growing. Generally speaking, companies without profits are expected to grow revenue every year, and at a good clip. As you can imagine, fast revenue growth, when maintained, often leads to fast profit growth.
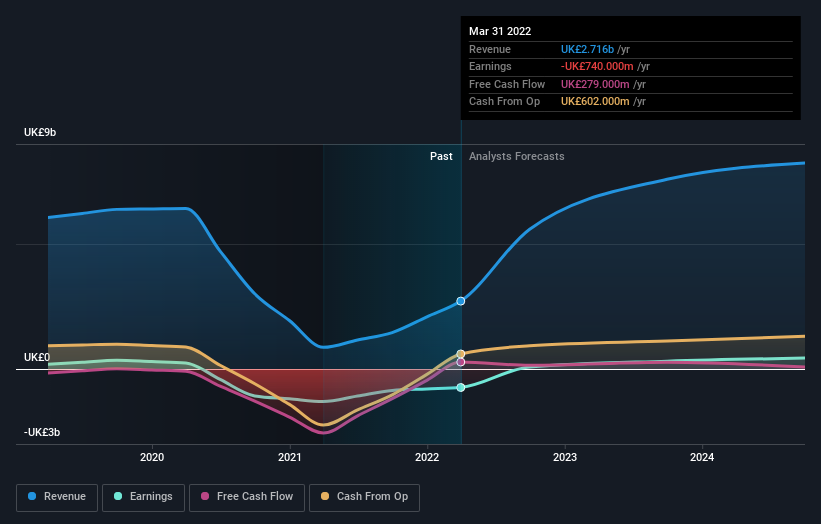
In the last five years easyJet saw its revenue shrink by 19% per year. That puts it in an unattractive cohort, to put it mildly. Arguably, the market has responded appropriately to this business performance by sending the share price down 10% (annualized) in the same time period. We don't generally like to own companies that lose money and don't grow revenues. You might be better off spending your money on a leisure activity. You'd want to research this company pretty thoroughly before buying, it looks a bit too risky for us.
The graphic below depicts how earnings and revenue have changed over time (unveil the exact values by clicking on the image).
It's probably worth noting we've seen significant insider buying in the last quarter, which we consider a positive. That said, we think earnings and revenue growth trends are even more important factors to consider. This free report showing analyst forecasts should help you form a view on easyJet
What about the Total Shareholder Return (TSR)?
We've already covered easyJet's share price action, but we should also mention its total shareholder return (TSR). The TSR is a return calculation that accounts for the value of cash dividends (assuming that any dividend received was reinvested) and the calculated value of any discounted capital raisings and spin-offs. Its history of dividend payouts mean that easyJet's TSR, which was a 51% drop over the last 5 years, was not as bad as the share price return.
A Different Perspective
We regret to report that easyJet shareholders are down 37% for the year. Unfortunately, that's worse than the broader market decline of 0.1%. However, it could simply be that the share price has been impacted by broader market jitters. It might be worth keeping an eye on the fundamentals, in case there's a good opportunity. Unfortunately, last year's performance may indicate unresolved challenges, given that it was worse than the annualised loss of 9% over the last half decade. Generally speaking long term share price weakness can be a bad sign, though contrarian investors might want to research the stock in hope of a turnaround. It's always interesting to track share price performance over the longer term. But to understand easyJet better, we need to consider many other factors. Consider for instance, the ever-present spectre of investment risk. We've identified 2 warning signs with easyJet (at least 1 which makes us a bit uncomfortable) , and understanding them should be part of your investment process.
easyJet is not the only stock insiders are buying. So take a peek at this free list of growing companies with insider buying.
Please note, the market returns quoted in this article reflect the market weighted average returns of stocks that currently trade on GB exchanges.
Have feedback on this article? Concerned about the content? Get in touch with us directly. Alternatively, email editorial-team (at) simplywallst.com.
This article by Simply Wall St is general in nature. We provide commentary based on historical data and analyst forecasts only using an unbiased methodology and our articles are not intended to be financial advice. It does not constitute a recommendation to buy or sell any stock, and does not take account of your objectives, or your financial situation. We aim to bring you long-term focused analysis driven by fundamental data. Note that our analysis may not factor in the latest price-sensitive company announcements or qualitative material. Simply Wall St has no position in any stocks mentioned.

