
 Yahoo Movies
 Investors in DigitalBridge Group (NYSE:DBRG) have unfortunately lost 62% over the last five years
Statistically speaking, long term investing is a profitable endeavour. But that doesn't mean long term investors can avoid big losses. For example, after five long years the DigitalBridge Group, Inc. (NYSE:DBRG) share price is a whole 70% lower. We certainly feel for shareholders who bought near the top. And some of the more recent buyers are probably worried, too, with the stock falling 57% in the last year. Furthermore, it's down 21% in about a quarter. That's not much fun for holders. We note that the company has reported results fairly recently; and the market is hardly delighted. You can check out the latest numbers in our company report.
With that in mind, it's worth seeing if the company's underlying fundamentals have been the driver of long term performance, or if there are some discrepancies.
View our latest analysis for DigitalBridge Group
DigitalBridge Group wasn't profitable in the last twelve months, it is unlikely we'll see a strong correlation between its share price and its earnings per share (EPS). Arguably revenue is our next best option. Generally speaking, companies without profits are expected to grow revenue every year, and at a good clip. That's because fast revenue growth can be easily extrapolated to forecast profits, often of considerable size.
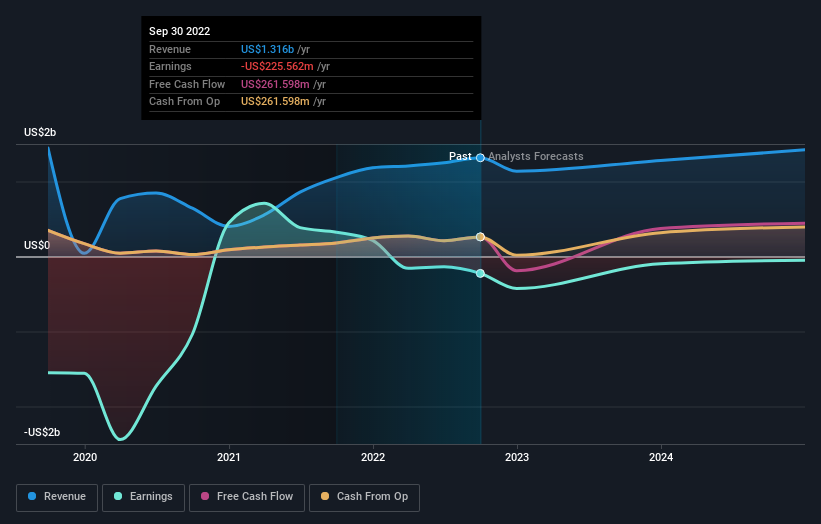
Over half a decade DigitalBridge Group reduced its trailing twelve month revenue by 25% for each year. That's definitely a weaker result than most pre-profit companies report. So it's not that strange that the share price dropped 11% per year in that period. We don't think this is a particularly promising picture. Of course, the poor performance could mean the market has been too severe selling down. That can happen.
The company's revenue and earnings (over time) are depicted in the image below (click to see the exact numbers).
It's good to see that there was some significant insider buying in the last three months. That's a positive. That said, we think earnings and revenue growth trends are even more important factors to consider. You can see what analysts are predicting for DigitalBridge Group in this interactive graph of future profit estimates.
What About Dividends?
As well as measuring the share price return, investors should also consider the total shareholder return (TSR). The TSR incorporates the value of any spin-offs or discounted capital raisings, along with any dividends, based on the assumption that the dividends are reinvested. So for companies that pay a generous dividend, the TSR is often a lot higher than the share price return. We note that for DigitalBridge Group the TSR over the last 5 years was -62%, which is better than the share price return mentioned above. This is largely a result of its dividend payments!
A Different Perspective
We regret to report that DigitalBridge Group shareholders are down 56% for the year (even including dividends). Unfortunately, that's worse than the broader market decline of 19%. However, it could simply be that the share price has been impacted by broader market jitters. It might be worth keeping an eye on the fundamentals, in case there's a good opportunity. Regrettably, last year's performance caps off a bad run, with the shareholders facing a total loss of 10% per year over five years. We realise that Baron Rothschild has said investors should "buy when there is blood on the streets", but we caution that investors should first be sure they are buying a high quality business. I find it very interesting to look at share price over the long term as a proxy for business performance. But to truly gain insight, we need to consider other information, too. For example, we've discovered 2 warning signs for DigitalBridge Group that you should be aware of before investing here.
DigitalBridge Group is not the only stock insiders are buying. So take a peek at this free list of growing companies with insider buying.
Please note, the market returns quoted in this article reflect the market weighted average returns of stocks that currently trade on US exchanges.
Have feedback on this article? Concerned about the content? Get in touch with us directly. Alternatively, email editorial-team (at) simplywallst.com.
This article by Simply Wall St is general in nature. We provide commentary based on historical data and analyst forecasts only using an unbiased methodology and our articles are not intended to be financial advice. It does not constitute a recommendation to buy or sell any stock, and does not take account of your objectives, or your financial situation. We aim to bring you long-term focused analysis driven by fundamental data. Note that our analysis may not factor in the latest price-sensitive company announcements or qualitative material. Simply Wall St has no position in any stocks mentioned.
Join A Paid User Research Session
You’ll receive a US$30 Amazon Gift card for 1 hour of your time while helping us build better investing tools for the individual investors like yourself. Sign up here

