
 Yahoo Movies
 Investing in ArcelorMittal (AMS:MT) three years ago would have delivered you a 63% gain
By buying an index fund, investors can approximate the average market return. But many of us dare to dream of bigger returns, and build a portfolio ourselves. For example, the ArcelorMittal S.A. (AMS:MT) share price is up 59% in the last three years, clearly besting the market return of around 21% (not including dividends). On the other hand, the returns haven't been quite so good recently, with shareholders up just 2.2% , including dividends .
Now it's worth having a look at the company's fundamentals too, because that will help us determine if the long term shareholder return has matched the performance of the underlying business.
View our latest analysis for ArcelorMittal
While markets are a powerful pricing mechanism, share prices reflect investor sentiment, not just underlying business performance. One way to examine how market sentiment has changed over time is to look at the interaction between a company's share price and its earnings per share (EPS).
During three years of share price growth, ArcelorMittal achieved compound earnings per share growth of 197% per year. This EPS growth is higher than the 17% average annual increase in the share price. So one could reasonably conclude that the market has cooled on the stock. We'd venture the lowish P/E ratio of 1.71 also reflects the negative sentiment around the stock.
The company's earnings per share (over time) is depicted in the image below (click to see the exact numbers).
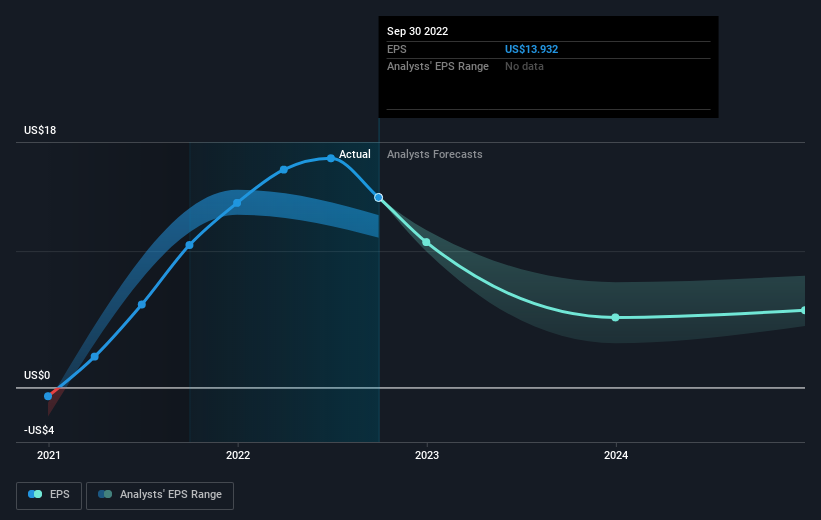
We know that ArcelorMittal has improved its bottom line over the last three years, but what does the future have in store? It might be well worthwhile taking a look at our free report on how its financial position has changed over time.
What About Dividends?
As well as measuring the share price return, investors should also consider the total shareholder return (TSR). The TSR is a return calculation that accounts for the value of cash dividends (assuming that any dividend received was reinvested) and the calculated value of any discounted capital raisings and spin-offs. Arguably, the TSR gives a more comprehensive picture of the return generated by a stock. In the case of ArcelorMittal, it has a TSR of 63% for the last 3 years. That exceeds its share price return that we previously mentioned. And there's no prize for guessing that the dividend payments largely explain the divergence!
A Different Perspective
We're pleased to report that ArcelorMittal shareholders have received a total shareholder return of 2.2% over one year. Of course, that includes the dividend. Since the one-year TSR is better than the five-year TSR (the latter coming in at 0.6% per year), it would seem that the stock's performance has improved in recent times. Someone with an optimistic perspective could view the recent improvement in TSR as indicating that the business itself is getting better with time. While it is well worth considering the different impacts that market conditions can have on the share price, there are other factors that are even more important. For example, we've discovered 1 warning sign for ArcelorMittal that you should be aware of before investing here.
Of course, you might find a fantastic investment by looking elsewhere. So take a peek at this free list of companies we expect will grow earnings.
Please note, the market returns quoted in this article reflect the market weighted average returns of stocks that currently trade on NL exchanges.
Have feedback on this article? Concerned about the content? Get in touch with us directly. Alternatively, email editorial-team (at) simplywallst.com.
This article by Simply Wall St is general in nature. We provide commentary based on historical data and analyst forecasts only using an unbiased methodology and our articles are not intended to be financial advice. It does not constitute a recommendation to buy or sell any stock, and does not take account of your objectives, or your financial situation. We aim to bring you long-term focused analysis driven by fundamental data. Note that our analysis may not factor in the latest price-sensitive company announcements or qualitative material. Simply Wall St has no position in any stocks mentioned.
Join A Paid User Research Session
You’ll receive a US$30 Amazon Gift card for 1 hour of your time while helping us build better investing tools for the individual investors like yourself. Sign up here
