
 Yahoo Movies
 Is Harworth Group plc's (LON:HWG) Latest Stock Performance A Reflection Of Its Financial Health?
Harworth Group (LON:HWG) has had a great run on the share market with its stock up by a significant 5.4% over the last week. Given that the market rewards strong financials in the long-term, we wonder if that is the case in this instance. In this article, we decided to focus on Harworth Group's ROE.
Return on equity or ROE is a key measure used to assess how efficiently a company's management is utilizing the company's capital. Put another way, it reveals the company's success at turning shareholder investments into profits.
View our latest analysis for Harworth Group
How Do You Calculate Return On Equity?
Return on equity can be calculated by using the formula:
Return on Equity = Net Profit (from continuing operations) ÷ Shareholders' Equity
So, based on the above formula, the ROE for Harworth Group is:
16% = UK£94m ÷ UK£578m (Based on the trailing twelve months to December 2021).
The 'return' refers to a company's earnings over the last year. So, this means that for every £1 of its shareholder's investments, the company generates a profit of £0.16.
What Is The Relationship Between ROE And Earnings Growth?
We have already established that ROE serves as an efficient profit-generating gauge for a company's future earnings. Depending on how much of these profits the company reinvests or "retains", and how effectively it does so, we are then able to assess a company’s earnings growth potential. Generally speaking, other things being equal, firms with a high return on equity and profit retention, have a higher growth rate than firms that don’t share these attributes.
A Side By Side comparison of Harworth Group's Earnings Growth And 16% ROE
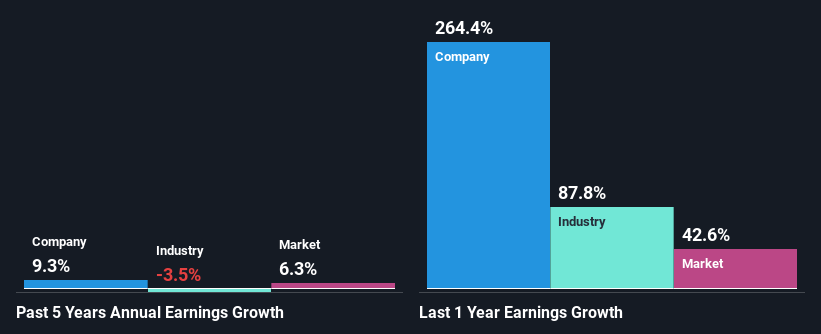
At first glance, Harworth Group seems to have a decent ROE. Especially when compared to the industry average of 9.1% the company's ROE looks pretty impressive. This probably laid the ground for Harworth Group's moderate 9.3% net income growth seen over the past five years.
When you consider the fact that the industry earnings have shrunk at a rate of 3.5% in the same period, the company's net income growth is pretty remarkable.
Earnings growth is an important metric to consider when valuing a stock. What investors need to determine next is if the expected earnings growth, or the lack of it, is already built into the share price. By doing so, they will have an idea if the stock is headed into clear blue waters or if swampy waters await. Is Harworth Group fairly valued compared to other companies? These 3 valuation measures might help you decide.
Is Harworth Group Efficiently Re-investing Its Profits?
In Harworth Group's case, its respectable earnings growth can probably be explained by its low three-year median payout ratio of 6.9% (or a retention ratio of 93%), which suggests that the company is investing most of its profits to grow its business.
Besides, Harworth Group has been paying dividends over a period of six years. This shows that the company is committed to sharing profits with its shareholders. Our latest analyst data shows that the future payout ratio of the company is expected to rise to 19% over the next three years. Accordingly, the expected increase in the payout ratio explains the expected decline in the company's ROE to 5.5%, over the same period.
Summary
In total, we are pretty happy with Harworth Group's performance. Specifically, we like that the company is reinvesting a huge chunk of its profits at a high rate of return. This of course has caused the company to see substantial growth in its earnings. That being so, according to the latest industry analyst forecasts, the company's earnings are expected to shrink in the future. To know more about the company's future earnings growth forecasts take a look at this free report on analyst forecasts for the company to find out more.
Have feedback on this article? Concerned about the content? Get in touch with us directly. Alternatively, email editorial-team (at) simplywallst.com.
This article by Simply Wall St is general in nature. We provide commentary based on historical data and analyst forecasts only using an unbiased methodology and our articles are not intended to be financial advice. It does not constitute a recommendation to buy or sell any stock, and does not take account of your objectives, or your financial situation. We aim to bring you long-term focused analysis driven by fundamental data. Note that our analysis may not factor in the latest price-sensitive company announcements or qualitative material. Simply Wall St has no position in any stocks mentioned.

