
 Yahoo Movies
 finnCap Group (LON:FCAP) shareholders have earned a 92% return over the last year
If you want to compound wealth in the stock market, you can do so by buying an index fund. But if you pick the right individual stocks, you could make more than that. For example, the finnCap Group plc (LON:FCAP) share price is up 83% in the last 1 year, clearly besting the market return of around 23% (not including dividends). That's a solid performance by our standards! We'll need to follow finnCap Group for a while to get a better sense of its share price trend, since it hasn't been listed for particularly long.
So let's investigate and see if the longer term performance of the company has been in line with the underlying business' progress.
See our latest analysis for finnCap Group
While markets are a powerful pricing mechanism, share prices reflect investor sentiment, not just underlying business performance. By comparing earnings per share (EPS) and share price changes over time, we can get a feel for how investor attitudes to a company have morphed over time.
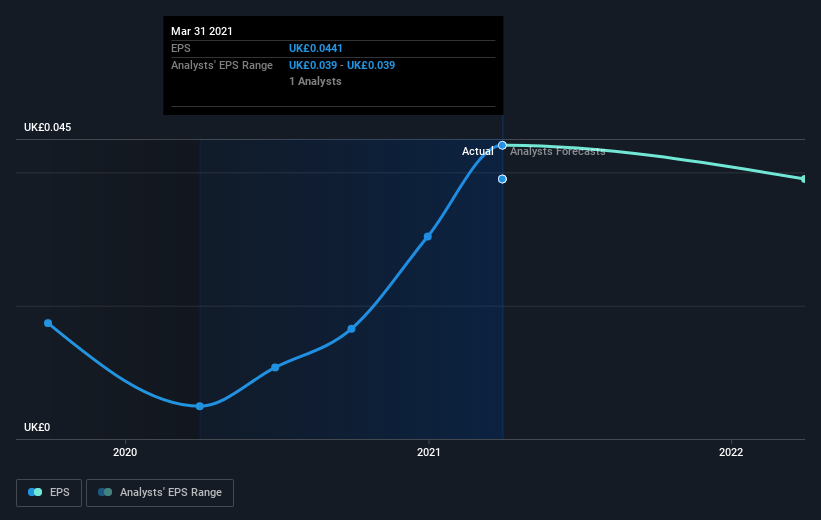
finnCap Group boasted truly magnificent EPS growth in the last year. We don't think the exact number is a good guide to the sustainable growth rate, but we do think this sort of increase is impressive. So we'd expect to see the share price higher. Strong growth like this can be evidence of a fundamental inflection point in the business, making it a good time to investigate the stock more closely.
The company's earnings per share (over time) is depicted in the image below (click to see the exact numbers).
We like that insiders have been buying shares in the last twelve months. Having said that, most people consider earnings and revenue growth trends to be a more meaningful guide to the business. Before buying or selling a stock, we always recommend a close examination of historic growth trends, available here..
What About Dividends?
As well as measuring the share price return, investors should also consider the total shareholder return (TSR). The TSR incorporates the value of any spin-offs or discounted capital raisings, along with any dividends, based on the assumption that the dividends are reinvested. It's fair to say that the TSR gives a more complete picture for stocks that pay a dividend. We note that for finnCap Group the TSR over the last 1 year was 92%, which is better than the share price return mentioned above. This is largely a result of its dividend payments!
A Different Perspective
finnCap Group boasts a total shareholder return of 92% for the last year (that includes the dividends) . We regret to report that the share price is down 1.4% over ninety days. Shorter term share price moves often don't signify much about the business itself. It's always interesting to track share price performance over the longer term. But to understand finnCap Group better, we need to consider many other factors. To that end, you should be aware of the 3 warning signs we've spotted with finnCap Group .
finnCap Group is not the only stock insiders are buying. So take a peek at this free list of growing companies with insider buying.
Please note, the market returns quoted in this article reflect the market weighted average returns of stocks that currently trade on GB exchanges.
This article by Simply Wall St is general in nature. We provide commentary based on historical data and analyst forecasts only using an unbiased methodology and our articles are not intended to be financial advice. It does not constitute a recommendation to buy or sell any stock, and does not take account of your objectives, or your financial situation. We aim to bring you long-term focused analysis driven by fundamental data. Note that our analysis may not factor in the latest price-sensitive company announcements or qualitative material. Simply Wall St has no position in any stocks mentioned.
Have feedback on this article? Concerned about the content? Get in touch with us directly. Alternatively, email editorial-team (at) simplywallst.com.

