
 Yahoo Movies
 Ethereum – poised and ready? ETH on-chain analysis (January 2022)
As Ethereum appears poised and ready for a potential breakout, Coin Rivet investigates Ethereum (ETH) on-chain for the month of January and walks you through the Ether charts.
How’re things looking on exchanges?
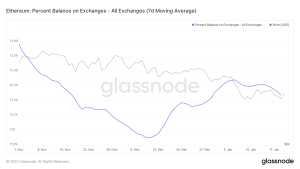
To begin unpacking the on-chain sentiment surrounding current ETH price action, the percent balance on exchanges is an ideal starting point – representing how much Ether is currently sat primed and ready in users’ exchange wallets.
The chart below highlights a crucial moment – on December 4 – in the aftermath of damaging Fed data and uncertainty around the Omicron variant the entire cryptomarket saw the onset of a bearish trend – market sentiment flipped sideways and Ether rushed back into exchange wallets for the first time since October 10.
A glance at the All Exchange Net Position Change Chart confirms the bearish price action was a turning point for Ethereum flows into exchanges.
By January 5, an additional 476,953 ETH (around $1.5bn in value) had been moved into exchange wallets indicating the gunpowder for a significant sell-off in the event that support at $3,000 failed.
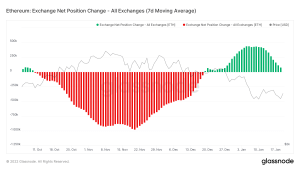
Recent weeks show exchange inflows are now diminishing, with the net position change seemingly set to return to a net outflow in the near future.
This provides reassurance that holders feel safe sat above $3,000 as twice-tested support – a strong piece of evidence for a bullish case – and stands indicative of a potential move from a market mentality of panic selling to one of accumulation.
Where’s the sell-pressure been coming from?
Speaking of panic sellers, a look at the iconic HODL waves chart can give us some insight into how price action ground down to $3,018.
The initial sell-off in response to the Fed and Omicron news in early December appears to have been primarily driven by the ‘Class of 17’, with holders likely unsettled as TradFi markets started hitting the deck (or perhaps just a little scarred from 2017/8).

But the real panic sell-off occurred on January 5 as bears took grip and forced a cascading dump that eventually caught support -23.6% later at $3,018. Sell pressure here came quite aggressively from coins last active three to six months ago.

A closer look at Total Supply Last Active three to six months ago – which would represent Ether bought between July and October 2021 – shows that the majority of these holdings were sold. This will have been motivated by fears of a break below $3,000 as seen in the summer, as three-to-six-month holders opted to breakeven or strategized to buy-back-in lower.
The HODL waves further evidence the view taken from the Exchange Balance charts, that Ether markets could be entering an accumulation period again.
After all, three-to-five-year holds are growing, indicating no major sell-off from long-term project backers, and there is the glimmer of traction growing among one week to one month holds. All of this is indicative of the supply thaw ending.
Read More: Latest Ethereum technical price analysis
Has ETH already peaked?
Finally, to round it off we ask the question: has ETH topped out yet?
Net Unrealised Profit/Loss (NUPL) helps to conceptualise the profit sat on the table through a calculation of the difference between market cap and realised market cap.
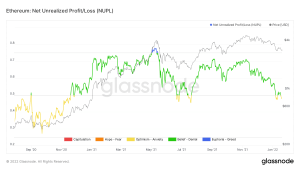
Typically on-chain analysts consider the NUPL to have topped out when it pushes above 0.75 (a market sentiment of euphoria and ultimate greed) – many on-chain analysts remain bullish on Bitcoin (BTC) as it failed to reach such heights – Ethereum (ETH), however, did hit this signal back in May (shown in blue).
This would normally be indicative of a top, but ETH continued to then post a sequential all-time high later that year – this didn’t produce a top signal. Therefore as Ether markets wrestle with anxious belief, it is quite possible things aren’t over just yet.
