
 Yahoo Movies
 Estimating The Intrinsic Value Of Panasonic Manufacturing Malaysia Berhad (KLSE:PANAMY)
Today we'll do a simple run through of a valuation method used to estimate the attractiveness of Panasonic Manufacturing Malaysia Berhad (KLSE:PANAMY) as an investment opportunity by taking the expected future cash flows and discounting them to their present value. Our analysis will employ the Discounted Cash Flow (DCF) model. It may sound complicated, but actually it is quite simple!
We generally believe that a company's value is the present value of all of the cash it will generate in the future. However, a DCF is just one valuation metric among many, and it is not without flaws. Anyone interested in learning a bit more about intrinsic value should have a read of the Simply Wall St analysis model.
See our latest analysis for Panasonic Manufacturing Malaysia Berhad
Step By Step Through The Calculation
We are going to use a two-stage DCF model, which, as the name states, takes into account two stages of growth. The first stage is generally a higher growth period which levels off heading towards the terminal value, captured in the second 'steady growth' period. To begin with, we have to get estimates of the next ten years of cash flows. Where possible we use analyst estimates, but when these aren't available we extrapolate the previous free cash flow (FCF) from the last estimate or reported value. We assume companies with shrinking free cash flow will slow their rate of shrinkage, and that companies with growing free cash flow will see their growth rate slow, over this period. We do this to reflect that growth tends to slow more in the early years than it does in later years.
A DCF is all about the idea that a dollar in the future is less valuable than a dollar today, so we discount the value of these future cash flows to their estimated value in today's dollars:
10-year free cash flow (FCF) forecast
2023 | 2024 | 2025 | 2026 | 2027 | 2028 | 2029 | 2030 | 2031 | 2032 | |
Levered FCF (MYR, Millions) | RM67.9m | RM93.0m | RM118.9m | RM138.9m | RM156.7m | RM172.5m | RM186.5m | RM199.0m | RM210.5m | RM221.3m |
Growth Rate Estimate Source | Analyst x1 | Analyst x1 | Analyst x1 | Est @ 16.82% | Est @ 12.84% | Est @ 10.05% | Est @ 8.10% | Est @ 6.74% | Est @ 5.78% | Est @ 5.11% |
Present Value (MYR, Millions) Discounted @ 12% | RM60.7 | RM74.4 | RM85.1 | RM89.0 | RM89.8 | RM88.4 | RM85.5 | RM81.7 | RM77.3 | RM72.7 |
("Est" = FCF growth rate estimated by Simply Wall St)
Present Value of 10-year Cash Flow (PVCF) = RM805m
The second stage is also known as Terminal Value, this is the business's cash flow after the first stage. The Gordon Growth formula is used to calculate Terminal Value at a future annual growth rate equal to the 5-year average of the 10-year government bond yield of 3.6%. We discount the terminal cash flows to today's value at a cost of equity of 12%.
Terminal Value (TV)= FCF2032 × (1 + g) ÷ (r – g) = RM221m× (1 + 3.6%) ÷ (12%– 3.6%) = RM2.8b
Present Value of Terminal Value (PVTV)= TV / (1 + r)10= RM2.8b÷ ( 1 + 12%)10= RM914m
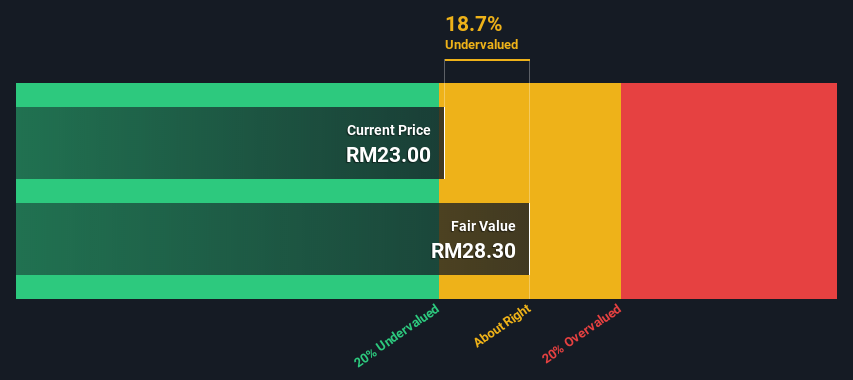
The total value, or equity value, is then the sum of the present value of the future cash flows, which in this case is RM1.7b. To get the intrinsic value per share, we divide this by the total number of shares outstanding. Compared to the current share price of RM23.0, the company appears about fair value at a 19% discount to where the stock price trades currently. The assumptions in any calculation have a big impact on the valuation, so it is better to view this as a rough estimate, not precise down to the last cent.
The Assumptions
Now the most important inputs to a discounted cash flow are the discount rate, and of course, the actual cash flows. If you don't agree with these result, have a go at the calculation yourself and play with the assumptions. The DCF also does not consider the possible cyclicality of an industry, or a company's future capital requirements, so it does not give a full picture of a company's potential performance. Given that we are looking at Panasonic Manufacturing Malaysia Berhad as potential shareholders, the cost of equity is used as the discount rate, rather than the cost of capital (or weighted average cost of capital, WACC) which accounts for debt. In this calculation we've used 12%, which is based on a levered beta of 1.070. Beta is a measure of a stock's volatility, compared to the market as a whole. We get our beta from the industry average beta of globally comparable companies, with an imposed limit between 0.8 and 2.0, which is a reasonable range for a stable business.
SWOT Analysis for Panasonic Manufacturing Malaysia Berhad
Strength
Currently debt free.
Dividends are covered by earnings and cash flows.
Weakness
Earnings declined over the past year.
Dividend is low compared to the top 25% of dividend payers in the Consumer Durables market.
Opportunity
Annual earnings are forecast to grow faster than the Malaysian market.
Current share price is below our estimate of fair value.
Threat
Revenue is forecast to grow slower than 20% per year.
Looking Ahead:
Although the valuation of a company is important, it ideally won't be the sole piece of analysis you scrutinize for a company. The DCF model is not a perfect stock valuation tool. Rather it should be seen as a guide to "what assumptions need to be true for this stock to be under/overvalued?" For example, changes in the company's cost of equity or the risk free rate can significantly impact the valuation. For Panasonic Manufacturing Malaysia Berhad, we've compiled three additional aspects you should assess:
Risks: For example, we've discovered 1 warning sign for Panasonic Manufacturing Malaysia Berhad that you should be aware of before investing here.
Future Earnings: How does PANAMY's growth rate compare to its peers and the wider market? Dig deeper into the analyst consensus number for the upcoming years by interacting with our free analyst growth expectation chart.
Other High Quality Alternatives: Do you like a good all-rounder? Explore our interactive list of high quality stocks to get an idea of what else is out there you may be missing!
PS. Simply Wall St updates its DCF calculation for every Malaysian stock every day, so if you want to find the intrinsic value of any other stock just search here.
Have feedback on this article? Concerned about the content? Get in touch with us directly. Alternatively, email editorial-team (at) simplywallst.com.
This article by Simply Wall St is general in nature. We provide commentary based on historical data and analyst forecasts only using an unbiased methodology and our articles are not intended to be financial advice. It does not constitute a recommendation to buy or sell any stock, and does not take account of your objectives, or your financial situation. We aim to bring you long-term focused analysis driven by fundamental data. Note that our analysis may not factor in the latest price-sensitive company announcements or qualitative material. Simply Wall St has no position in any stocks mentioned.
Join A Paid User Research Session
You’ll receive a US$30 Amazon Gift card for 1 hour of your time while helping us build better investing tools for the individual investors like yourself. Sign up here
