
 Yahoo Movies
 Does Balfour Beatty (LON:BBY) Have A Healthy Balance Sheet?
David Iben put it well when he said, 'Volatility is not a risk we care about. What we care about is avoiding the permanent loss of capital.' So it might be obvious that you need to consider debt, when you think about how risky any given stock is, because too much debt can sink a company. We note that Balfour Beatty plc (LON:BBY) does have debt on its balance sheet. But the more important question is: how much risk is that debt creating?
What Risk Does Debt Bring?
Generally speaking, debt only becomes a real problem when a company can't easily pay it off, either by raising capital or with its own cash flow. Ultimately, if the company can't fulfill its legal obligations to repay debt, shareholders could walk away with nothing. However, a more usual (but still expensive) situation is where a company must dilute shareholders at a cheap share price simply to get debt under control. Having said that, the most common situation is where a company manages its debt reasonably well - and to its own advantage. When we think about a company's use of debt, we first look at cash and debt together.
Check out our latest analysis for Balfour Beatty
What Is Balfour Beatty's Debt?
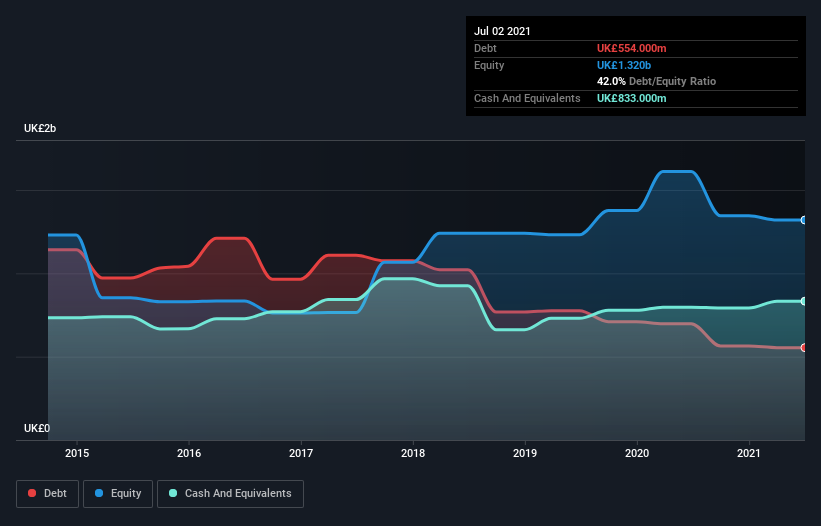
As you can see below, Balfour Beatty had UK£554.0m of debt at July 2021, down from UK£698.0m a year prior. But it also has UK£833.0m in cash to offset that, meaning it has UK£279.0m net cash.
A Look At Balfour Beatty's Liabilities
According to the last reported balance sheet, Balfour Beatty had liabilities of UK£2.28b due within 12 months, and liabilities of UK£1.11b due beyond 12 months. Offsetting these obligations, it had cash of UK£833.0m as well as receivables valued at UK£1.02b due within 12 months. So its liabilities outweigh the sum of its cash and (near-term) receivables by UK£1.53b.
This deficit is considerable relative to its market capitalization of UK£1.76b, so it does suggest shareholders should keep an eye on Balfour Beatty's use of debt. This suggests shareholders would be heavily diluted if the company needed to shore up its balance sheet in a hurry. While it does have liabilities worth noting, Balfour Beatty also has more cash than debt, so we're pretty confident it can manage its debt safely.
In addition to that, we're happy to report that Balfour Beatty has boosted its EBIT by 68%, thus reducing the spectre of future debt repayments. The balance sheet is clearly the area to focus on when you are analysing debt. But ultimately the future profitability of the business will decide if Balfour Beatty can strengthen its balance sheet over time. So if you want to see what the professionals think, you might find this free report on analyst profit forecasts to be interesting.
Finally, a company can only pay off debt with cold hard cash, not accounting profits. Balfour Beatty may have net cash on the balance sheet, but it is still interesting to look at how well the business converts its earnings before interest and tax (EBIT) to free cash flow, because that will influence both its need for, and its capacity to manage debt. Over the last three years, Balfour Beatty actually produced more free cash flow than EBIT. That sort of strong cash generation warms our hearts like a puppy in a bumblebee suit.
Summing up
Although Balfour Beatty's balance sheet isn't particularly strong, due to the total liabilities, it is clearly positive to see that it has net cash of UK£279.0m. And it impressed us with free cash flow of UK£303m, being 160% of its EBIT. So is Balfour Beatty's debt a risk? It doesn't seem so to us. When analysing debt levels, the balance sheet is the obvious place to start. But ultimately, every company can contain risks that exist outside of the balance sheet. For example, we've discovered 2 warning signs for Balfour Beatty that you should be aware of before investing here.
Of course, if you're the type of investor who prefers buying stocks without the burden of debt, then don't hesitate to discover our exclusive list of net cash growth stocks, today.
This article by Simply Wall St is general in nature. We provide commentary based on historical data and analyst forecasts only using an unbiased methodology and our articles are not intended to be financial advice. It does not constitute a recommendation to buy or sell any stock, and does not take account of your objectives, or your financial situation. We aim to bring you long-term focused analysis driven by fundamental data. Note that our analysis may not factor in the latest price-sensitive company announcements or qualitative material. Simply Wall St has no position in any stocks mentioned.
Have feedback on this article? Concerned about the content? Get in touch with us directly. Alternatively, email editorial-team (at) simplywallst.com.

