
 Yahoo Movies
 Despite delivering investors losses of 46% over the past 3 years, JBG SMITH Properties (NYSE:JBGS) has been growing its earnings
In order to justify the effort of selecting individual stocks, it's worth striving to beat the returns from a market index fund. But its virtually certain that sometimes you will buy stocks that fall short of the market average returns. We regret to report that long term JBG SMITH Properties (NYSE:JBGS) shareholders have had that experience, with the share price dropping 51% in three years, versus a market return of about 32%. And the ride hasn't got any smoother in recent times over the last year, with the price 26% lower in that time.
While the stock has risen 5.2% in the past week but long term shareholders are still in the red, let's see what the fundamentals can tell us.
View our latest analysis for JBG SMITH Properties
While markets are a powerful pricing mechanism, share prices reflect investor sentiment, not just underlying business performance. By comparing earnings per share (EPS) and share price changes over time, we can get a feel for how investor attitudes to a company have morphed over time.
JBG SMITH Properties became profitable within the last five years. That would generally be considered a positive, so we are surprised to see the share price is down. So it's worth looking at other metrics to try to understand the share price move.
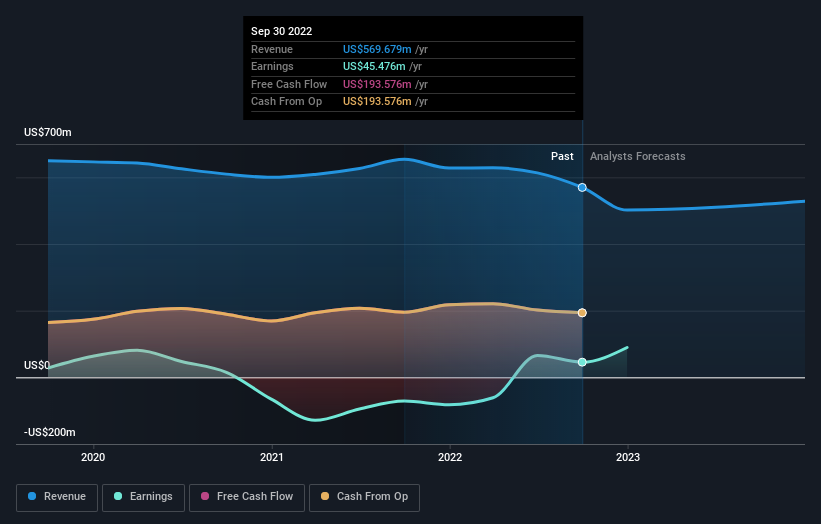
Given the healthiness of the dividend payments, we doubt that they've concerned the market. JBG SMITH Properties has maintained its top line over three years, so we doubt that has shareholders worried. A closer look at revenue and profit trends might yield insights.
The graphic below depicts how earnings and revenue have changed over time (unveil the exact values by clicking on the image).
We consider it positive that insiders have made significant purchases in the last year. Having said that, most people consider earnings and revenue growth trends to be a more meaningful guide to the business. So we recommend checking out this free report showing consensus forecasts
What About Dividends?
As well as measuring the share price return, investors should also consider the total shareholder return (TSR). The TSR incorporates the value of any spin-offs or discounted capital raisings, along with any dividends, based on the assumption that the dividends are reinvested. Arguably, the TSR gives a more comprehensive picture of the return generated by a stock. In the case of JBG SMITH Properties, it has a TSR of -46% for the last 3 years. That exceeds its share price return that we previously mentioned. And there's no prize for guessing that the dividend payments largely explain the divergence!
A Different Perspective
We regret to report that JBG SMITH Properties shareholders are down 23% for the year (even including dividends). Unfortunately, that's worse than the broader market decline of 7.7%. Having said that, it's inevitable that some stocks will be oversold in a falling market. The key is to keep your eyes on the fundamental developments. Unfortunately, last year's performance may indicate unresolved challenges, given that it was worse than the annualised loss of 5% over the last half decade. Generally speaking long term share price weakness can be a bad sign, though contrarian investors might want to research the stock in hope of a turnaround. It's always interesting to track share price performance over the longer term. But to understand JBG SMITH Properties better, we need to consider many other factors. Case in point: We've spotted 4 warning signs for JBG SMITH Properties you should be aware of, and 1 of them makes us a bit uncomfortable.
There are plenty of other companies that have insiders buying up shares. You probably do not want to miss this free list of growing companies that insiders are buying.
Please note, the market returns quoted in this article reflect the market weighted average returns of stocks that currently trade on US exchanges.
Have feedback on this article? Concerned about the content? Get in touch with us directly. Alternatively, email editorial-team (at) simplywallst.com.
This article by Simply Wall St is general in nature. We provide commentary based on historical data and analyst forecasts only using an unbiased methodology and our articles are not intended to be financial advice. It does not constitute a recommendation to buy or sell any stock, and does not take account of your objectives, or your financial situation. We aim to bring you long-term focused analysis driven by fundamental data. Note that our analysis may not factor in the latest price-sensitive company announcements or qualitative material. Simply Wall St has no position in any stocks mentioned.
Join A Paid User Research Session
You’ll receive a US$30 Amazon Gift card for 1 hour of your time while helping us build better investing tools for the individual investors like yourself. Sign up here
