
 Yahoo Movies
 The Cost of Gas the Decade You Were Born
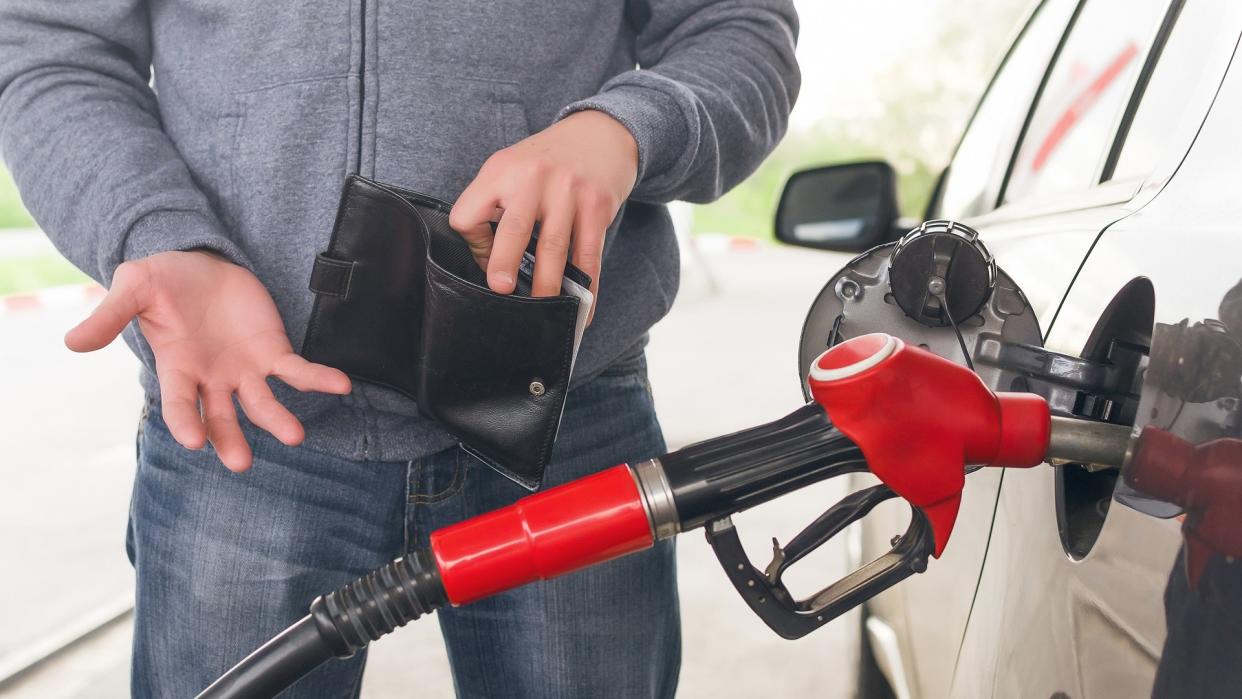
Gas prices are finally starting to fall back down to earth in much of the country. According to AAA, the national average is down to $4.189 per gallon as of Aug. 2. Fuel costs started to climb just as today’s raging inflation began forcing up the price of just about everything more than a year ago.
There’s nothing unusual about that.
SNAP Schedule: When Can I Anticipate August 2022 Payments?
See: 7 Surprisingly Easy Ways To Reach Your Retirement Goals
Throughout history, the inflation rate has had a big impact on what drivers pay at the pump — and it’s been that way since the start of the Great Depression over 90 years ago. Keep reading to learn how gas prices have changed over the decades — and why.
The Early Years: Smooth Sailing for Nearly 2 Decades
Gas prices remained remarkably steady for nearly two decades, from the start of the Great Depression through the end of World War II.
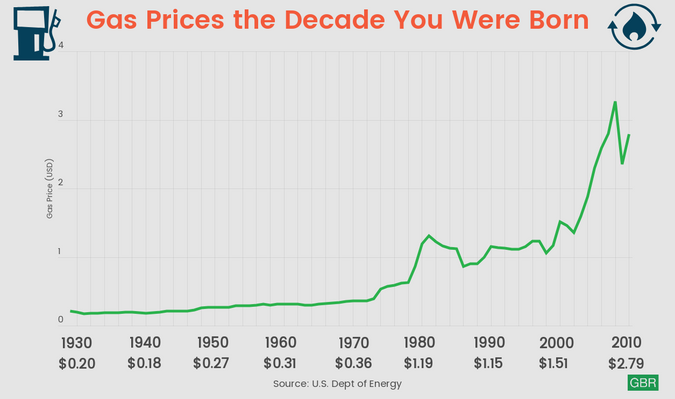
The price per gallon was 21 cents in both 1929 and 1946. In the 17 years between, the cost of gas fell to 17 cents only once and never rose above 21 cents. Generally, prices held within a penny or two of 20 cents the entire time despite two of the most economically consequential events in world history unfolding during that period.
For context as to just how low and steady inflation was in those years, 20 cents in 1930 was worth $3.47 in 2022 dollars. In 1946, it was worth $3.26.
Take Our Poll: Do You Think You Will Be Able To Retire at Age 65?
Post-War Inflation in the Late ’40s Looked a Lot Like It Does Today
Economists tend to fixate on the hyperinflation of the 1970s when seeking historical context for today’s situation. But according to Barron’s, a sharp rise in inflation that gripped America in the late 1940s more closely mirrors the events of 2022.
When World War II ended, the American economy was flooded with pent-up demand following years of rationing and deprivation — just as it was when vaccines rolled out as the economy reopened post-pandemic.
In the late 1940s, post-war demand tapered off and the global supply chain rebounded, just like today. The economy cooled, inflation soared and the country entered a brief recession.
One year after the war ended, the CPI inflation rate was 3.1% year over year. Nine months later it peaked at a sky-high 20.1% — much more severe than even the turmoil of the 1970s and ’80s when the inflation rate peaked around 14%.
Thanks to Inflation and Steady Prices, Gas Was Cheaper 20 Years Later
By 1950, gas prices had jumped to 27 cents, about $3.40 in today’s money. The next two decades were much like the two that preceded the war. Fuel prices held remarkably steady, climbing only to 34 cents by 1969.
Because of inflation, 34 cents was worth only $2.83 in 1969, meaning the real price of gas had actually fallen. Motorists in the 1950s and ’60s enjoyed some of the cheapest gas on record — but it wouldn’t last.
The 1970s: An Energy Crisis and High-Octane Inflation
In 1973, the Organization of Petroleum Exporting Countries (OPEC) punished America for its support of Israel with a devastating embargo that sent oil prices up by 350%, according to the Smithsonian National Museum of American History.
In 1970, a gallon of gas cost 36 cents. By 1981, it had more than tripled to $1.19. For context as to just how bad things are now, $1.19 in 1981 was worth $4.05 in today’s money — gas was actually cheaper back then at the height of the crisis.
As Inflation Fell, So, Too, Did Gas Prices
The hyperinflation of the 1970s peaked near 14% in 1980. After a major recession the next year, the Federal Resserve’s aggressive monetary policy finally won the day. The inflation rate quickly fell back into single digits and averaged 3.5% in the second half of the 1980s.
From the late ’80s through the arrival of the pandemic, inflation was essentially a nonissue. The rate held steady for more than three decades, breaching 5% only briefly and only once at the start of the Great Recession.
Gas prices during that time closely tracked inflation, remaining relatively steady and relatively low throughout the 1980s, ’90s and into the 21st century. The price per gallon never topped 90 cents in the closing years of the ’80s — about $2.40 today. A decade later in 1996-97, prices peaked at $1.23, which is almost exactly the same in 2022 dollars as it was in 1987 — $2.36.
It wasn’t until 2005, when inflation began rising briefly again, that gas hit $2.30 a gallon — about $3.57 in today’s money.
In 2010, gas prices reached $2.79, about $3.82 in 2022 dollars. The next year in 2011, as America was digging itself out of the worst economic catastrophe since the Great Recession, gas soared to $3.53 per gallon — or $4.75, when adjusted for inflation — which is higher than even the price per gallon today.
More From GOBankingRates
All inflation-based dollar adjustments were made using the Bureau of Labor Statistics (BLS) Consumer Price Index (CPI) inflation calculator.
This article originally appeared on GOBankingRates.com: The Cost of Gas the Decade You Were Born

