
 Yahoo Movies
 Is Chubb Limited's (NYSE:CB) Recent Stock Performance Tethered To Its Strong Fundamentals?
Chubb's (NYSE:CB) stock is up by a considerable 15% over the past three months. Given the company's impressive performance, we decided to study its financial indicators more closely as a company's financial health over the long-term usually dictates market outcomes. Particularly, we will be paying attention to Chubb's ROE today.
Return on Equity or ROE is a test of how effectively a company is growing its value and managing investors’ money. In short, ROE shows the profit each dollar generates with respect to its shareholder investments.
See our latest analysis for Chubb
How To Calculate Return On Equity?
ROE can be calculated by using the formula:
Return on Equity = Net Profit (from continuing operations) ÷ Shareholders' Equity
So, based on the above formula, the ROE for Chubb is:
13% = US$6.1b ÷ US$48b (Based on the trailing twelve months to September 2022).
The 'return' is the income the business earned over the last year. So, this means that for every $1 of its shareholder's investments, the company generates a profit of $0.13.
Why Is ROE Important For Earnings Growth?
Thus far, we have learned that ROE measures how efficiently a company is generating its profits. Depending on how much of these profits the company reinvests or "retains", and how effectively it does so, we are then able to assess a company’s earnings growth potential. Assuming everything else remains unchanged, the higher the ROE and profit retention, the higher the growth rate of a company compared to companies that don't necessarily bear these characteristics.
A Side By Side comparison of Chubb's Earnings Growth And 13% ROE
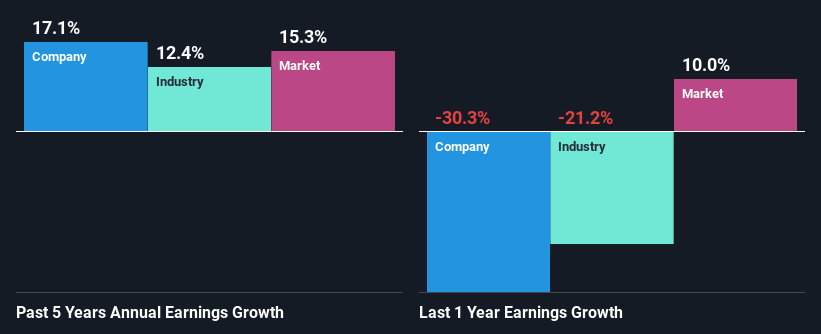
At first glance, Chubb seems to have a decent ROE. Further, the company's ROE is similar to the industry average of 13%. This probably goes some way in explaining Chubb's moderate 17% growth over the past five years amongst other factors.
As a next step, we compared Chubb's net income growth with the industry, and pleasingly, we found that the growth seen by the company is higher than the average industry growth of 12%.
Earnings growth is a huge factor in stock valuation. What investors need to determine next is if the expected earnings growth, or the lack of it, is already built into the share price. Doing so will help them establish if the stock's future looks promising or ominous. What is CB worth today? The intrinsic value infographic in our free research report helps visualize whether CB is currently mispriced by the market.
Is Chubb Using Its Retained Earnings Effectively?
With a three-year median payout ratio of 25% (implying that the company retains 75% of its profits), it seems that Chubb is reinvesting efficiently in a way that it sees respectable amount growth in its earnings and pays a dividend that's well covered.
Besides, Chubb has been paying dividends for at least ten years or more. This shows that the company is committed to sharing profits with its shareholders. Upon studying the latest analysts' consensus data, we found that the company is expected to keep paying out approximately 23% of its profits over the next three years. As a result, Chubb's ROE is not expected to change by much either, which we inferred from the analyst estimate of 14% for future ROE.
Summary
Overall, we are quite pleased with Chubb's performance. Particularly, we like that the company is reinvesting heavily into its business, and at a high rate of return. Unsurprisingly, this has led to an impressive earnings growth. With that said, the latest industry analyst forecasts reveal that the company's earnings growth is expected to slow down. Are these analysts expectations based on the broad expectations for the industry, or on the company's fundamentals? Click here to be taken to our analyst's forecasts page for the company.
Have feedback on this article? Concerned about the content? Get in touch with us directly. Alternatively, email editorial-team (at) simplywallst.com.
This article by Simply Wall St is general in nature. We provide commentary based on historical data and analyst forecasts only using an unbiased methodology and our articles are not intended to be financial advice. It does not constitute a recommendation to buy or sell any stock, and does not take account of your objectives, or your financial situation. We aim to bring you long-term focused analysis driven by fundamental data. Note that our analysis may not factor in the latest price-sensitive company announcements or qualitative material. Simply Wall St has no position in any stocks mentioned.
Join A Paid User Research Session
You’ll receive a US$30 Amazon Gift card for 1 hour of your time while helping us build better investing tools for the individual investors like yourself. Sign up here
