
 Yahoo Movies
 Capital Allocation Trends At Graham (NYSE:GHM) Aren't Ideal
Ignoring the stock price of a company, what are the underlying trends that tell us a business is past the growth phase? More often than not, we'll see a declining return on capital employed (ROCE) and a declining amount of capital employed. This indicates to us that the business is not only shrinking the size of its net assets, but its returns are falling as well. Having said that, after a brief look, Graham (NYSE:GHM) we aren't filled with optimism, but let's investigate further.
Understanding Return On Capital Employed (ROCE)
Just to clarify if you're unsure, ROCE is a metric for evaluating how much pre-tax income (in percentage terms) a company earns on the capital invested in its business. Analysts use this formula to calculate it for Graham:
Return on Capital Employed = Earnings Before Interest and Tax (EBIT) ÷ (Total Assets - Current Liabilities)
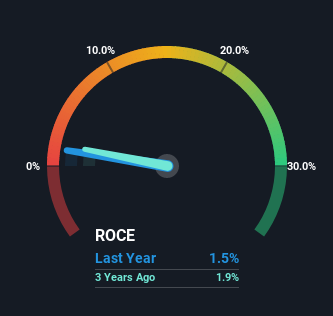
0.015 = US$1.8m ÷ (US$208m - US$86m) (Based on the trailing twelve months to December 2022).
Therefore, Graham has an ROCE of 1.5%. In absolute terms, that's a low return and it also under-performs the Machinery industry average of 11%.
See our latest analysis for Graham
Above you can see how the current ROCE for Graham compares to its prior returns on capital, but there's only so much you can tell from the past. If you'd like, you can check out the forecasts from the analysts covering Graham here for free.
What The Trend Of ROCE Can Tell Us
There is reason to be cautious about Graham, given the returns are trending downwards. About five years ago, returns on capital were 3.2%, however they're now substantially lower than that as we saw above. And on the capital employed front, the business is utilizing roughly the same amount of capital as it was back then. Companies that exhibit these attributes tend to not be shrinking, but they can be mature and facing pressure on their margins from competition. If these trends continue, we wouldn't expect Graham to turn into a multi-bagger.
While on the subject, we noticed that the ratio of current liabilities to total assets has risen to 41%, which has impacted the ROCE. Without this increase, it's likely that ROCE would be even lower than 1.5%. And with current liabilities at these levels, suppliers or short-term creditors are effectively funding a large part of the business, which can introduce some risks.
Our Take On Graham's ROCE
In the end, the trend of lower returns on the same amount of capital isn't typically an indication that we're looking at a growth stock. Investors haven't taken kindly to these developments, since the stock has declined 35% from where it was five years ago. Unless there is a shift to a more positive trajectory in these metrics, we would look elsewhere.
If you're still interested in Graham it's worth checking out our FREE intrinsic value approximation to see if it's trading at an attractive price in other respects.
While Graham isn't earning the highest return, check out this free list of companies that are earning high returns on equity with solid balance sheets.
Have feedback on this article? Concerned about the content? Get in touch with us directly. Alternatively, email editorial-team (at) simplywallst.com.
This article by Simply Wall St is general in nature. We provide commentary based on historical data and analyst forecasts only using an unbiased methodology and our articles are not intended to be financial advice. It does not constitute a recommendation to buy or sell any stock, and does not take account of your objectives, or your financial situation. We aim to bring you long-term focused analysis driven by fundamental data. Note that our analysis may not factor in the latest price-sensitive company announcements or qualitative material. Simply Wall St has no position in any stocks mentioned.
Join A Paid User Research Session
You’ll receive a US$30 Amazon Gift card for 1 hour of your time while helping us build better investing tools for the individual investors like yourself. Sign up here
